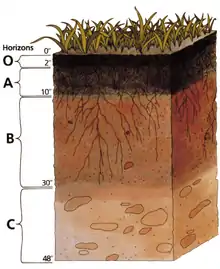
Pedometric mapping
Pedometric mapping, or statistical soil mapping, is data-driven generation of soil property and class maps that is based on use of statistical methods.[1][2][3] The main objective of pedometric mapping is to predict values of some soil variable at unobserved locations and access the uncertainty of that estimate using statistical inference i.e. statistically optimal approaches. From the application point of view, the main objective of soil mapping is to accurately predict response of a soil-plant ecosystem to various soil management strategies. In other words, the main objective of pedometric mapping is to generate maps of soil properties and soil classes that can be used to feed other environmental models or for decision making. Pedometric mapping is largely based on applying geostatistics in soil science and other statistical methods used in pedometrics.
Although pedometric mapping is mainly data-driven, it can also largely be based on use of expert knowledge. The expert knowledge, however, needs to be plugged-in into a pedometric computational framework so that it can be used to produce more accurate prediction models. For example, data assimilation techniques, such as the space–time Kalman filter, can be used to integrate pedogenetic knowledge and field observations.[4]
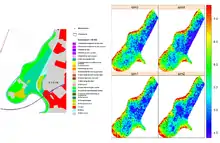
In the information theory context, the objective of pedometric mapping is to describe the spatial complexity of soils (information content of soil variables over a geographical area), then represent this complexity using maps, summary measures, mathematical models and simulations.[5] Simulations are a preferred way of visualizing soil patterns as they represent both the deterministic pattern due to the landscape, geographic hot-spots and short range variability (see image below).
Pedometrics
Pedometrics is the application of mathematical and statistical methods for the study of the distribution and genesis of soils.[6]
Pedometrics is a portmanteau of the Greek roots pedos (soil) and metron (measurement). Measurement in this case is restricted to mathematical and statistical methods as it relates to pedology, the branch of soil science that studies soil in its natural setting.
Pedometrics addresses soil related problems when there is uncertainty due to deterministic or stochastic variation, vagueness and lack of knowledge of soil properties and processes. It relies upon mathematical, statistical, and numerical methods and includes numerical approaches to classification to deal with a supposed deterministic variation. Simulation models incorporate uncertainty by adopting chaos theory, statistical distribution, or fuzzy logic.
Pedometrics addresses pedology from the perspective of emerging scientific fields such as wavelets analysis, fuzzy set theory and data mining in soil data modelling applications. The advance of pedometrics is also linked to improvements in remote and close-range sensing.[7]
Pedometric vs traditional soil mapping
In traditional soil survey, spatial distribution of soil properties and soil bodies can be inferred using mental models which leads to manual delineations. Such methods can be considered to be subjective, and it is hence difficult or impossible to statistically assess the accuracy of such maps without additional field sampling. Traditional soil survey mapping has some limitations for use in a multithematic GIS related to the fact that is often not consistently applied by different mappers, it is largely manual and it is difficult to automate. Most of traditional soil maps in the world are based on manual delineations of assumed soil bodies, to which then soil attributes are attached.[8][9] In the case of pedometric mapping, all outputs are based on using rigorous statistical computing and are hence reproducible.
Pedometric mapping is largely based on using extensive and detailed covariate layers such as Digital Elevation Model (DEM) derivatives, remote sensing imagery, climatic, land cover and geological GIS layers and imagery. Evolution of pedometric mapping can be closely connected with the emergence of new technologies and global, publicly available data sources such as the SRTM DEM, MODIS, ASTER and Landsat imagery, gamma radiometrics and LiDAR imagery, and new automated mapping methods.
| Expert/knowledge-driven soil mapping | Data/technology-driven (pedometric) soil mapping | |
|---|---|---|
| Target variables: | Soil types (soil series) | Analytical soil properties |
| Spatial data model: | Discrete (soil bodies) | Continuous/hybrid (quantities / probabilities) |
| Major inputs: | Expert knowledge / soil profile description | Laboratory data / proximal soil sensing |
| Important covariates: | Soil delineations (photo-interpretation) | Remote sensing images, DEM-derivatives |
| Spatial prediction model: | Averaging per polygon | Automated (geo)statistics |
| Accuracy assessment: | Validation of soil mapping units (kappa) | Cross-validation (RMSE) |
| Data representation: | Polygon maps + attribute tables (2D) | Gridded maps (2D/3D) + prediction error map or simulations |
| Major technical aspect: | Cartographic scale | Grid cell size |
| Soil sampling strategies: | Free survey (surveyor selects sampling locations) | Statistical (design/model-based sampling designs) |
Pedometric vs digital soil mapping
Pedometric analyses relies strictly on geostatistics, whereas digital soil mapping uses more traditional soil mapping concepts not strictly pedometric in nature. Also referred to as predictive soil mapping,[10] digital soil mapping relies on computer-assisted inference of soil properties to produce digital maps of discrete soil types. Pedometric mapping does not produce maps delineating discrete soil types.
Methods
Pedometric mapping methods differ based on the soil survey data processing steps:
- Sampling
- Data screening
- Preprocessing of soil covariates
- Fitting of geostatistical model
- Spatial prediction
- Cross-validation / accuracy assessment
- Visualization of outputs
One of the main theoretical basis for pedometric mapping is the universal model of soil variation:[4][11]

where is the deterministic part of soil variation, is the stochastic, spatially auto-correlated part of variation, and is the remaining residual variation (measurement errors, short-range variability etc.) that is also possibly dependent on , but it is not modeled. This model has been first time introduced by French mathematician Georges Matheron, and has shown to be the Best Unbiased Linear Predictor for spatial data. One way of using this model to produce predictions or simulations is by means of regression-kriging (also known as universal kriging). In the case of soil data, the deterministic component of the model is often modeled using the soil forming factors: climate, organism, relief, parent material, or lithology, and time. This conceptual model is known as the CLORPT model, and has been the first time introduced to soil-landscape modelling by Hans Jenny.[2]


A special group of techniques of pedometric mapping focus on downscaling the spatial information that can be area-based or continuous. Prediction of soil classes is also another sub-field of pedometric mapping where specific geostatistical methods are used for the purpose of interpolation of factor-type of variables.
Pedometric mapping is also largely based on using novel technologies for measuring soil properties, also referred to as the digital soil mapping techniques. These include:
- Soil spectroscopy and proximal soil sensing (hand-held or vehicle-driven devices)
- Remote sensing systems for mapping and monitoring soils (e.g. SMOS)
- LiDAR technology to produce digital elevation models
- Precision agriculture technologies
References
- Hengl, Tomislav (2003). Pedometric mapping : bridging the gaps between conventional and pedometric approaches. [Wageningen: s.n. ISBN 9789058088963.
- Grunwald, edited by Sabine (2006). Environmental soil-landscape modeling geographic information technologies and pedometrics. Boca Raton, FL: CRC/Taylor & Francis. ISBN 9780824723897.CS1 maint: extra text: authors list (link)
- Kempen, B.; Heuvelink, G. B. M.; Brus, D. J.; Stoorvogel, J. J. (10 March 2010). "Pedometric mapping of soil organic matter using a soil map with quantified uncertainty". European Journal of Soil Science. 61 (3): 333–347. doi:10.1111/j.1365-2389.2010.01232.x.
- Heuvelink, G.B.M; Webster, R (30 April 2001). "Modelling soil variation: past, present, and future". Geoderma. 100 (3–4): 269–301. Bibcode:2001Geode.100..269H. doi:10.1016/S0016-7061(01)00025-8.
- Hengl, T.; Nikolić, M.; MacMillan, R.A. (31 March 2012). "Mapping efficiency and information content". International Journal of Applied Earth Observation and Geoinformation. 22: 127–138. doi:10.1016/j.jag.2012.02.005.
- Heuvelink, Gerard (December 2003). "The Definition of Pedometrics" (PDF). Pedometron. International Working Group on Pedometrics - Provisional Commission on Pedometrics of the International Union of Soil Sciences (15). Archived from the original (PDF) on 2007-09-30. Retrieved 2006-11-01.
- Peter A., Burrough; Johan Bouma; Scott R. Yates (1994). "The state of the art in pedometrics" (PDF). Geoderma. Elsevier Science B. V., Amsterdam. 62 (1–3): 311–326. Bibcode:1994Geode..62..311B. doi:10.1016/0016-7061(94)90043-4. Retrieved 2006-11-01.
- McBratney, A.B; Mendonça Santos, M.L; Minasny, B (1 November 2003). "On digital soil mapping". Geoderma. 117 (1–2): 3–52. Bibcode:2003Geode.117....3M. doi:10.1016/S0016-7061(03)00223-4.
- Behrens, Thorsten; Scholten, Thomas (1 June 2006). "Digital soil mapping in Germany—a review". Journal of Plant Nutrition and Soil Science. 169 (3): 434–443. doi:10.1002/jpln.200521962.
- Scull, P.; J. Franklin; O.A. Chadwick; D. McArthur (June 2003). "Predictive soil mapping - a review". Progress in Physical Geography. Sage Publications. 27 (2): 171–197. doi:10.1191/0309133303pp366ra.
- Burrough, P.A. (1986). Principles of Geographical Information Systems for Land Resources Assessment. Clarendon Press. p. 194.
External links
- Pedometrics Commission of the International Union of Soil Sciences
- ISRIC — World Soil Information data centre
- International Society for Geomorphometry
- Open Source tools for soil scientists by the California Soil Resource Lab
- Working Group on Digital Soil Mapping