Soil morphology
Soil morphology is the study of the formation and description of soil types within various soil horizons.[1] C.F. Marbut championed reliance on soil morphology instead of on theories of pedogenesis for soil classification because theories of soil genesis are both ephemeral and dynamic.[2]
Observable attributes typically analyzed in the field include the composition, form, soil structure and organization of the soil. Color of the base soil and features such as mottling, distribution of roots and pores, consistency of the soil and evidence of mineral presence also contribute to the classification.
The observations are typically performed on a soil profile in order to analyze the various soil horizons. A profile is a vertical cut, two-dimensional, in the soil and bounds one side of a pedon. A pedon is the smallest unit, containing all soil horizons. Pedons are typically 1 square meter on top and capture the lateral range of variability of the soil down to the bedrock.
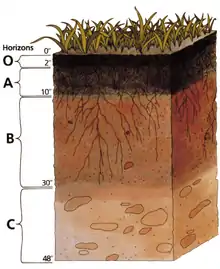
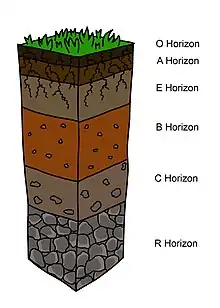
Soil Horizons
Soil horizons are different layers of a soil profile that are characterized by different properties obtained from various soil forming processes.
O Horizon - layer that is dominated by organic material, usually from plant or animal litter. This horizon is subject to rapid change, and thus not usually used in the description of a soil. [3]
A Horizon - Layer formed just below the O horizon, usually referred to as the topsoil. This layer is a mineral horizon that has been darkened by organic matter [3]
E Horizon - Mineral horizon that is characterized by the loss of oxides, iron, and clay through the process of leaching, also known as eluviation. Usually has a high concentration of sand and silt particles as the clay is leached out. [1]
B Horizon - Mineral horizon that is defined by the materials that have accumulated from the above horizons. The minerals and oxides that were lost to eluviation in the above E horizon illuviate into this layer.[1]
C Horizon - Layer that is most representative of the soil’s parent material. Made up of semi-weathered material that is between soil and rock. This is the layer that holds the most biological activity
R Layer - Unconsolidated bedrock
Soil Formation
Form
Soils are formed from their respective parent material, which may or may not match the composition of the bedrock that they lie on top of. Through biological and chemical processes as well as natural processes such as wind and water erosion, parent material can be broken down. The chemical and physical properties of this parent material is reflected in the qualities of the resulting soil. Climate, topography, and biological organisms all have an impact on the formation of soils in various geographic locations[4]
Topography
A steep landform is going to see an increased amount of runoff when compared to a flat landform. Increased runoff can inhibit soil formation as the upper layers continue to get stripped off because they are not developed enough to support root growth. Root growth can help prevent erosion as the roots act to keep the soil in place. This phenomenon leads to soils on slopes being thinner and less developed than soils found on plains or plateaus.[5]
Climate
Varying levels of precipitation and wind have impacts on the formation of soils. Increased precipitation can lead to increased levels of runoff as previously described, but regular amounts of precipitation can encourage plant root growth which works to stop runoff. The growth of vegetation in a certain area can also work to increase the depth and nutrient quality of a topsoil, as decomposition of organic matter works to strengthen organic soil horizons.
Biological Processes
Varying levels of microbial activity can have a range of impacts on soil formation. Most often, biological processes work to disrupt existing soil formation which leads to chemical translocation. the movement of these chemicals can make nutrients available, which can increase plant root growth.
Micromorphology
While soil micromorphology begins in the field with the routine and careful use of a 10x hand lens, much more can be described by careful description of thin sections made of the soil with the aid of a petrographic polarizing light microscope. The soil can be impregnated with an epoxy resin, but more commonly with a polyester resin (crystic 17449) and sliced and ground to 0.03 millimeter thickness and examined by passing light through the thin soil plasma.
Porosity
Porosity of topsoil is a measure of the pore space in soil which typically decreases as grain size increases. This is due to soil aggregate formation in finer textured surface soils when subject to soil biological processes. Aggregation involves particulate adhesion and higher resistance to compaction. Porosity of a soil is a function of the soil’s bulk density, which is based on the composition of the soil. Sandy soils typically have higher bulk densities and lower porosity than silty or clayey soils. This is because finer grained particles have a larger amount of pore space than coarser grained particles. The table below displays the deal bulk densities that both allow and restrict root growth for the three main texture classifications. The porosity of a soil is an important factor that determines the amount of water a soil can hold, how much air it can hold, and subsequently how well plant roots can grow within the soil.[6]
Soil porosity is complex. Traditional models regard porosity as continuous. This fails to account for anomalous features and produces only approximate results. Furthermore it cannot help model the influence of environmental factors which affect pore geometry. A number of more complex models have been proposed, including fractals, bubble theory, cracking theory, Boolean grain process, packed sphere, and numerous other models.[7]
Soil Texture
Soil texture is the analysis and classification of the varying amounts of particles present in the soil. Soil texture triangles are used to determine the measure of clay, sand and silt present. The volume of these particles determines the appearance, feel and chemical properties of the soil.[8]
Methods of determining texture
The measure of texture by hand is a simple way of estimating the sand, silt and clay amounts and ultimately estimating the soil type. This is typically done in the field when precise measurement tools are unavailable.
Soil texture estimation in the field
To estimate by hand, scientists in the field will take a handful of sifted soil and moisten it with water until it holds together. The soil is then rolled into a ball nearing 1-2 inches in diameter, called a bolus, until it is no longer sticky. With the bolus in hand, the thumb is then used to attempt to press out the soil into what is called a ribbon. A ribbon is successfully achieved when the soil is 2mm in thickness, and 1–2 cm wide. Characteristics such as the length of the ribbon, color of the moistened soil and the level of crumble are taken into account and used to estimate the soil type.
Soil texture estimation in the lab
An experienced soil scientist can determine soil texture in the field with decent accuracy, as described above. However, not all soils lend themselves to accurate field determinations of soil texture due to the presence of other particles that interfere with measuring the concentration of sand, silt and clay. The mineral texture can be obfuscated by high soil organic matter, iron oxides, amorphous or short-range-order aluminosilicates, and carbonates. In order to precisely determine the amount of clay, sand and silt in a soil, it must be taken to a laboratory for analysis. A strategy known as Particle Size Analysis (PSA) is performed, beginning with the pretreatment of the soil in order to remove all other particles such as organic matter that may interfere with the classification. Pretreatment must leave the soil as strictly sand, silt and clay particles. Pretreatment may consist of processes such as the sieving of the soil to remove larger particles, thus allowing the soil to be dispersed properly. Hydrometer tests may then be used to calculate the amounts of sand, silt and clay present. This consists of mixing the pretreated soil with water and then allowing the mixture to settle, making note of the hydrometer reading. Sand particles are the largest, and thus will settle the quickest, followed by the silt particles, and lastly the clay particles. The sections are then dried and weighed. The three sections should add up to 100% in order for the test to be considered successful. From here, the soil can be classified using a soil triangle, which labels the type of soil based on the percentages of each particle in the sample.

Soil micromorphology in Archaeology
Soil micromorphology has been a recognized technique in soil science for some 50 years and experience from pedogenic and paleosol studies first permitted its use in the investigation of archaeologically buried soils. More recently, the science has expanded to encompass the characterization of all archeological soils and sediments and has been successful in providing unique cultural and paleoenvironmental information from a whole range of archaeological sites.[9]
See also
References
- Buol, Stanley W.; Southard, Randal J.; Graham, Robert C.; McDaniel, Paul A. (2003). Soil Genesis and Classification (5th ed.). Ames, Iowa: Iowa State Press, A Blackwell Pub. Co. p. 494. ISBN 0-8138-2873-2.
- Soil Survey Staff (1993). Soil Survey Manual. Washington D.C.: U. S. Government Printing Office. Soil Conservation Service, United States Department of Agriculture Handbook 18. Archived from the original on 2007-02-07. Retrieved 2006-11-03.
- Pelegrino, JD (2020-05-25). "Soil Horizons". Future Farmers of America.
- Queensland, c=AU; o=The State of. "How soils form | Soils explained". www.qld.gov.au. Retrieved 2020-11-25.
- "Soil Formation - an overview | ScienceDirect Topics". www.sciencedirect.com. Retrieved 2020-11-25.
- USDA Natural Resource Conservation Service. Soil Quality Indicators: Bulk Density [Fact sheet]. U.S Department of Agriculture. https://www.nrcs.usda.gov/Internet/FSE_DOCUMENTS/nrcs142p2_053256.pdf
- Horgan, Graham W. (1996). "A review of soil pore models" (PDF). Retrieved 2006-11-03.
- Brown, Katharine. “Soil Texture – Measuring in the Field.” Measuring Soil Texture in the Field | Fact Sheets, 2020, soilquality.org.au/factsheets/soil-texture. http://soilquality.org.au/factsheets/soil-texture
- Macphail, Richard I; Courty, Marie-Agnès; Goldberg, Paul (January 1990). "Soil micromorphology in archaeology". Endeavour. 14 (4): 163–171. doi:10.1016/0160-9327(90)90039-t. ISSN 0160-9327.