Pinneberg (electoral district)
Pinneberg is an electoral constituency (German: Wahlkreis) represented in the Bundestag. It elects one member via first-past-the-post voting. Under the current constituency numbering system, it is designated as constituency 7. It is located in southwestern Schleswig-Holstein, coterminous with the Pinneberg district.[1]
| 7 Pinneberg | |
|---|---|
| electoral district for the Bundestag | |
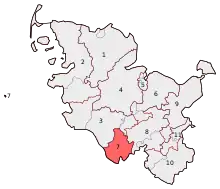 Pinneberg in 2013 | |
| State | Schleswig-Holstein |
| Population | 307,500 (2015) |
| Electorate | 238,533 (2017) |
| Major settlements | Elmshorn Pinneberg Wedel |
| Area | 664.3 km2 |
| Current electoral district | |
| Created | 1949 |
| Party | CDU |
| Member | Michael von Abercron |
| Elected | 2017 |
Pinneberg was created for the inaugural 1949 federal election. Since 2017, it has been represented by Michael von Abercron of the Christian Democratic Union (CDU).[2]
Geography
Pinneberg is located in southwestern Schleswig-Holstein. As of the 2021 federal election, it is coterminous with the Pinneberg district. This includes the small Heligoland islands (1.7 km2, population 1,309) off the North Sea coast.[1]
History
Pinneberg was created in 1949. Until 1965, it was constituency 12 in the number system; from 1965 to 1976 it was constituency 9. Since 1976, it has been constituency 7. It has been coterminous with the Pinneberg district since its creation.
Members
The constituency was held by the Social Democratic Party (SPD) during the inaugural term of the Bundestag, during which time it was represented by Anni Krahnstöver. It was won by the Christian Democratic Union (CDU) in 1953, and represented by Wilhelm Goldhagen (until 1961) and Rolf Bremer. In 1969, it was won again by the SPD, and represented in turn by Hans-Ulrich Brand and Hermann P. Reiser, who each served for a single term. Party fellow Reinhard Ueberhorst represented it from 1976 until 1983, when it was won by Ingrid Roitzsch of the CDU. She was succeeded by Gert Willner from 1994 to 1998 before the constituency was again won by the SPD. Ernst Dieter Rossmann represented it for two terms. Ole Schröder of the CDU served from 2005 to 2017, before being succeeded by party fellow Michael von Abercron in 2017.
| Election | Member | Party | % | |
|---|---|---|---|---|
| 1949 | Anni Krahnstöver | SPD | 36.3 | |
| 1953 | Wilhelm Goldhagen | CDU | 38.9 | |
| 1957 | 45.8 | |||
| 1961 | 41.4 | |||
| 1965 | Rolf Bremer | CDU | 50.0 | |
| 1969 | Hans-Ulrich Brand | SPD | 46.3 | |
| 1972 | Hermann P. Reiser | SPD | 51.3 | |
| 1976 | Reinhard Ueberhorst | SPD | 46.2 | |
| 1980 | 48.6 | |||
| 1983 | Ingrid Roitzsch | CDU | 49.5 | |
| 1987 | 45.9 | |||
| 1990 | 43.9 | |||
| 1994 | Gert Willner | CDU | 44.7 | |
| 1998 | Ernst Dieter Rossmann | SPD | 47.9 | |
| 2002 | 46.4 | |||
| 2005 | Ole Schröder | CDU | 44.2 | |
| 2009 | 40.8 | |||
| 2013 | 45.4 | |||
| 2017 | Michael von Abercron | CDU | 39.7 | |
Election results
2017 election
| Federal election (2017): Pinneberg[3] | |||||||||
|---|---|---|---|---|---|---|---|---|---|
| Notes: |
Blue background denotes the winner of the electorate vote.
| ||||||||
| Party | Candidate | Votes | % | ±% | Party votes | % | ±% | ||
| CDU | Michael von Abercron | 73,816 | 39.7 | 63,863 | 34.3 | ||||
| SPD | Ernst Dieter Rossmann | 56,460 | 30.3 | 42,729 | 22.9 | ||||
| Green | Bernd Möbius | 15,379 | 8.3 | 21,336 | 11.4 | ||||
| AfD | Joachim Schneider | 14,729 | 7.9 | 15,977 | 8.6 | ||||
| FDP | Olaf Klampe | 14,441 | 7.8 | 24,735 | 13.3 | ||||
| Left | Cornelia Möhring | 11,270 | 6.1 | 13,111 | 7.0 | ||||
| PARTEI | 2,200 | 1.2 | |||||||
| FW | 954 | 0.5 | |||||||
| BGE | 541 | 0.3 | |||||||
| NPD | 446 | 0.2 | |||||||
| ÖDP | 428 | 0.2 | |||||||
| MLPD | 52 | 0.0 | |||||||
| Informal votes | 1,620 | 1,343 | |||||||
| Total Valid votes | 186,095 | 186,372 | |||||||
| Turnout | 187,715 | 78.7 | |||||||
| CDU hold | Majority | 17,356 | 9.4 | ||||||
2013 election
| Federal election (2013): Pinneberg[4] | |||||||||
|---|---|---|---|---|---|---|---|---|---|
| Notes: |
Blue background denotes the winner of the electorate vote.
| ||||||||
| Party | Candidate | Votes | % | ±% | Party votes | % | ±% | ||
| CDU | 80,483 | 45.4 | 72,006 | 40.6 | |||||
| SPD | Ernst Dieter Rossmann | 64,006 | 36.1 | 55,371 | 31.2 | ||||
| Green | Valerie Wilms | 11,324 | 6.4 | 15,291 | 8.6 | ||||
| Left | Cornelia Möhring | 6,985 | 3.9 | 8,910 | 5.0 | ||||
| AfD | Sebastian Hausmann | 6,766 | 3.8 | 8,479 | 4.8 | ||||
| FDP | Olaf Klampe | 3,303 | 1.9 | 9,863 | 5.6 | ||||
| Pirates | Birgitt Piepgras | 3,225 | 1.8 | 3,370 | 1.9 | ||||
| NPD | Ingo Stawitz | 1,260 | 0.7 | 1,319 | 0.7 | ||||
| Tierschutzpartei | 1,271 | 0.7 | |||||||
| FW | 786 | 0.4 | |||||||
| Rentner | 665 | 0.4 | |||||||
| MLPD | 42 | 0.0 | |||||||
| Informal votes | 1,703 | 1,682 | |||||||
| Total Valid votes | 177,352 | 177,373 | |||||||
| Turnout | 179,055 | 76.0 | |||||||
| CDU hold | Majority | 16,477 | 9.3 | ||||||
2009 election
| Federal election (2009): Pinneberg[5] | |||||||||
|---|---|---|---|---|---|---|---|---|---|
| Notes: |
Blue background denotes the winner of the electorate vote.
| ||||||||
| Party | Candidate | Votes | % | ±% | Party votes | % | ±% | ||
| CDU | 70,458 | 40.8 | 57,203 | 33.1 | |||||
| SPD | Ernst Dieter Rossmann | 54,950 | 31.8 | 45,540 | 26.3 | ||||
| FDP | Olaf Klampe | 17,018 | 9.8 | 28,640 | 16.6 | ||||
| Green | Valerie Wilms | 16,143 | 9.3 | 20,978 | 12.1 | ||||
| Left | Klaus-Dieter Brügmann | 11,794 | 6.8 | 13,412 | 7.8 | ||||
| Pirates | 3,659 | 2.1 | |||||||
| NPD | Ingo Stawitz | 1,912 | 1.1 | 1,743 | 1.0 | ||||
| Rentner | 1,571 | 0.9 | |||||||
| Independent | Rolf Hoffmann | 529 | 0.3 | ||||||
| DVU | 193 | 0.1 | |||||||
| MLPD | 56 | 0.0 | |||||||
| Informal votes | 3,384 | 3,193 | |||||||
| Total Valid votes | 172,804 | 172,995 | |||||||
| Turnout | 176,188 | 75.6 | |||||||
| CDU hold | Majority | 15,508 | 9.0 | ||||||
References
- "Constituency Pinneberg". Federal Returning Officer.
- "Results for Pinneberg". Federal Returning Officer.
- Results for Pinneberg
- Results for Pinneberg
- Results for Pinneberg
| Current | |
|---|---|
| Other states |
|
| See also | |
