Pollution in Door County, Wisconsin
Pollution in Door County, Wisconsin relates to the degree of pollution in the air, water, and land in Door County, Wisconsin. Pollution is defined as the addition of any substance (solid, liquid, or gas) or any form of energy (such as heat, sound, or radioactivity) to the environment at a faster rate than it can be dispersed, diluted, decomposed, recycled, or stored in some harmless form.[2]

Air
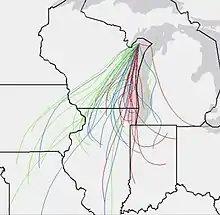
Most air pollution in Door County comes from outside the county. This map shows how air travels to the pollution monitor in Newport State Park.[3] Because the monitor is near the shore, only the red lines (which show the lower air currents) meaningfully depict the path of ozone to the monitor. As shown on the map, these lower currents carry polluted air from major urban areas. But further inland, the air from higher up mixes more, so all color lines are significant when tracing the path of air pollution further inland. These higher currents (shown in green and blue) blow in from cleaner, mostly rural areas.[4]
The stability of air over the Lake Michigan shore along with the lake breezes may increase the concentration of ozone along the shoreline.[5]
Wells, soils, and surface waters
Aquifers
Door County has three types of aquifers. The newest is in a relatively shallow layer of sand and gravel, but tends to not to provide enough water except in the southeastern part of the county. Further down are layers of dolomite bedrock that are recharged by water percolating from the layer of sand and gravel. Past the dolomite is a layer of shale that does not contain water, although potentially it is a source of oil. Past the shale is a layer of sandstone that is also host to a bedrock aquifer. Only a few wells tap this deepest and oldest aquifer.[6] Due to the tilt of the layers and erosion, there are areas of the county missing certain layers. A study of three city wells serving Sturgeon Bay found that water from the surface fell anywhere from 13 to 115 feet per day from the surface down to the dolomite aquifer. When the snow melted in the spring, the water coming up from one well changed 9 days later to reflect the character of the new meltwater.[7]
Springs
Groundwater burbles up from the shallow aquifer through the fractured bedrock, forming fracture springs. It also may seep more slowly through the ground, forming seepage springs. Detailed measurements were taken of one fracture and three seepage springs during a 2014–2017 survey.[8] Although the fracture spring had large variations in output, it still had a greater flow rate than the other 409 springs surveyed. It had one of the highest specific conductance measurements (995 µS/cm) among the springs studied, due to the minerals dissolved in the water.[9] An earlier study comparing spring water and well water from five springs and 47 wells in Sevastopol found that spring water was more turbid than well water and more likely to be contaminated by coliform bacteria. Nitrates, chloride, and specific conductance were not significantly different between the springs and wells.[10]
Wells
The combination of shallow soils and fractured bedrock makes well water contamination more likely. At any given time, at least one-third of private wells may contain bacteria, and in situations with quickly flowing underground water, wells may test clean one day but contaminated the next. Some household wells turn brown every spring from nearby manure applications.[11] In September 2014, 16 people feel ill from drinking wellwater after rainwater washed manure went down a sinkhole in Jacksonport.[12]
The porous and fractured dolomite bedrock was implicated as a factor in a June 2007 epidemic when 239 patrons and 18 employees[13] of the newly opened Log Den restaurant were sickened by a norovirus. Six were hospitalized. The virus was found to have traveled from a septic field 188 m (617 ft) away to the restaurant's well, contaminating their water.[14] From September to December 2007 a study was conducted in which dyes were placed into the septic system. The dyes traveled through the groundwater at about 2 miles per year, and researchers concluded that viral contaminants could travel "many miles in their life times."[15] For transient non-community public wells such as the one supplying the restaurant, state only regulated for contaminants within a 200-foot radius unless flow studies had previously been done. Modeling research supporting this decision predicted that pathogens would be unlikely to travel more than 155 feet per year.[16]
After the Milwaukee Journal published an Insight article about septic system problems in the county in 1971, 28% of tourists surveyed in person and 57% of tourists surveyed by telephone reported having read the article. 13% of tourists surveyed by phone said that if water pollution increased, they would stop visiting the county. But the Chamber of Commerce spokesman and one other resort owner said they thought the publicity was good advertising. 14 out of 15 resort owners surveyed said their business had not declined from the previous year, although six thought the article hurt tourism and two thought their businesses had been negatively affected. A study found that those who thought bad water was the county's main problem were less likely to return, and that the water quality problem was hurting tourism.[17]
Soils and groundwater

The Wisconsin Department of Natural Resources reports 137 leaking underground storage tank sites, 385 spill locations, and 104 other areas involving contamination, such as of soils and groundwater, including 24 cases which polluted one or more neighboring properties and 82 open cases such as cherry orchards left with arsenic and lead-contaminated soils from pesticide use during the 1960s and earlier.[19] Additionally, two landowners voluntarily cooperated with the DNR, limiting their future liability.[20] Mines, prior landfills, and former orchard sites are considered impaired lands and specially marked on an electronic county map.[21] A different electronic map shows the locations of private wells polluted with lead, arsenic, and other contaminants down to the section level.[22]
Bioaccumulation
PCBs from Green Bay have been deposited into the county as windborne dust[23] and off of contaminated waters.[24] The state lists 6.85 miles of the Ahnapee River in Door County as an impaired waterway due to PCB pollution, a designation extending past the county line.[25] In 1975, PCBs were found in the eggs of red-breasted and common merganser ducks in the county and were implicated along with DDE and mercury as possible explanations for eggshell thinning.[26]
Walleye found in the Sturgeon Bay and Little Sturgeon area had 87% more PCBs[lower-alpha 1] than walleye from the western side of Green Bay at the mouth of the Oconto River. This fits what is known about the distribution of PCBs which spread from industries in the Fox River Valley.[27]
In 1964 on Little Sister Island only 41% of herring gull eggs hatched. High levels of DDT were found to be the main cause of death among the unhatched chicks.[28]

Beach contamination
35 beaches are routinely monitored for water quality advisories.[30] Before the state beach monitoring program, an outbreak at Nicolet Beach in Peninsula State Park sickened 68 people in July 2002.[31] A two-year study of selected Door County beaches concluded that neither the abundance of bird droppings nor bird populations reliably predicted E. coli contamination,[lower-alpha 2][32] although rainfall was associated with elevated E. coli levels in six out of eight beaches studied.[33] From 2011–2015, a beach improvement program worked to reduce runoff.[34]
Mats of Cladophora algae provide homes for Salmonella bacteria.[35]
Salinification
Between 1996 and 2006, impervious surfaces in the county increased by 0.6 square miles (about 400 acres). In 2006 a total of 1% of all land in the county was paved. Over the same period, 0.8 square miles (about 500 acres) were deforested and 0.6 square miles were lost to agriculture. As development increases water quality is expected to worsen and the risk of flooding is expected to increase.[36] During the 2018 to 2019 winter season, 9,470 tons of salt were applied to state, county, and town roads.[37] Road salt has been credited with fostering the growth of salt tolerant Phragmites australis (giant cane) and Typha angustifolia (narrowleaved cattail) in roadside ditches.[38] Across the Great Lakes region, roadside salt spread within 500 meters of lake has been credited with increasing the salinity of the lakewater.[39]
Agricultural nonpoint source pollution
In 2017, farmers spent $2,825,000 on agricultural chemicals,[40] in addition to $5,295,000 on fertilizer, lime, and soil conditioners;[41] as a result agricultural practices are potential source of nonpoint-source pollution.
Social responses
A 2009 study of Union, Gardener, and Nasewaupee property owners along with property owners in townships from other counties along southern Green Bay found that people owning bayfront properties valued a reduction in nonpoint source pollution more strongly than those owning properties further inland.[42] Another factor motivating opposition to nonpoint source pollution in the county has been a desire to have a suburban rather than agricultural neighborhood environment.[43]
Notes
- This figure came from comparing an average concentration of PCBs from the whole body of the fish.
- Bird counts at 10 beaches in the summer of 2004 (first year of this study) found that Whitefish Dunes had the most birds, followed by Portage Park, Ellison Bay, Egg Harbor, and Bailey's Harbor. Random grid sampling of avian waste found that the beach at Whitefish Dunes had the greatest number of droppings, followed by Portage Park in second place and Bailey's Harbor in third, with Ellison Bay and Sister Bay tying as the beaches with the fourth most droppings. Meanwhile, the five beaches with the highest average E. coli concentrations were at Sunset Park, Otumba, Ellison Bay, Fish Creek, and Egg Harbor.[29]
References
- Door County Hazard Mitigation Plan by the Door County Planning Department, June 28, 2016, Chapter 2: Risk Assessment, p. 43
- "Pollution - Definition from the Encyclopedia Britannica". britannica.com. 28 February 2018. Retrieved 5 March 2018.
- Photo of the monitoring station on p. 128 of WI DNR. "Air Monitoring Network Plan 2016 June 2015" (PDF). EPA. Retrieved 6 February 2019.
- U.S. EPA. "Wisconsin: Northern Milwaukee/Ozaukee Shoreline Area, Sheboygan County Area, Manitowoc County Area, Door County Area Final Area Designations for the 2015 Ozone National Ambient Air Quality Standards Technical Support Document (TSD)" (PDF). Green Book. Retrieved February 7, 2019.
- Relations between Meteorology and Ozone in the Lake Michigan Breeze by Steven R. Hanna and Joseph C. Chang, Journal of Applied Meteorology 34, March 1995, p. 678 (p. 9 of the pdf)
- Geology and ground water in Door County, Wisconsin, with emphasis on contamination potential in the Silurian dolomite by M.G. Sherrill Section: "Hydrologic Characteristics of Rock Units," 1978, U.S. Geological Survey Water-Supply Paper 2047, pp. 11–12
- Field Verification of Capture Zones for Municipal Wells at Sturgeon Bay, Wisconsin by Kenneth R. Bradbury, Todd W. Rayne, and Maureen A. Muldoon, 2002, Open-File Report 2001-01, p. 3
- Wisconsin Springs: Data, see the four points located in the county on the electronic map, Susan Swanson, Wisconsin Geological and Natural History Survey
- An inventory of springs in Wisconsin by Susan K. Swanson, Grace E. Graham, and David J. Hart, Wisconsin Geological and Natural History Survey Bulletin 113, 2019, p. 8 (p. 14 of the pdf) and p. 13 (p. 19 of the pdf)
- Hydrogeology and Groundwater Monitoring of Fractured Dolomite in the Upper Door Priority Watershed, Door County, Wisconsin by Bradbury, K.R., Muldoon, M.A., Wisconsin Geological & Natural History Survey # WOFR1992-02, January 1992
- Protect the Water You Drink pamphlet, by Debbie Beyer, UW-Extension Basin Education Initiative; Shelby Giguere, and the Door County Soil and Water Conservation Department. See also Groundwater Quality Changes in a Karst Aquifer of Northeastern Wisconsin, USA: Reduction of Brown Water Incidence and Bacterial Contamination Resulting from Implementation of Regional Task Force Recommendations by Kevin Erb, Eric Ronk, Vikram Koundinya, and John Luczaj, published in Resources 2015, 4, 655–672; doi:10.3390/resources4030655
- Residents seek answers after Jacksonport manure spill, December 4, 2014, Door Couty Advocate
- 2007 Annual Report: Door County Public Health Department by Rhonda Kolberg, page 57 (page 58 of the pdf)
- Norovirus outbreak caused by a new septic system in a dolomite aquifer, by Mark A. Borchardt, Kenneth R. Bradbury, Elizabeth C. Alexander, Rhonda J Kolberg, S Catherine. P Alexander, John R. Archer, Laurel A Braatz, Brian M. Forest, Jeffrey Alan Green, Susan K. Spencer, published in Ground Water. 2011 Jan-Feb;49(1):85–97. doi: 10.1111/j.1745-6584.2010.00686.x.
- Plum Bottom Closed Depression Groundwater Trace Final Report by E. Calvin Alexander, Jr., Jeffrey A. Green, and Scott C. Alexander 25 January 2008
- Jay Y. Hodgson. (2002). Source Water Assessment Implementation Obstacles: Are Transient Noncommunity Wells Not As Important? Water Resources IMPACT, 4(2), page 18
- Appendix H of Groundwater quality, Door County, Wisconsin: an assessment of the institutional and physical constraints on economic development, recreational growth, and ground water quality, edited by Harry Leslie. Report of the Water Resources Management Workshop held May, 1973. Madison: Institute for Environmental Studies, University of Wisconsin-Madison, pp. 153–172 (pp. 187–206 of the pdf)
- Historical Use of Lead Arsenate and Survey of Soil Residues in Former Apple Orchards in Virginia by Therese Nowak Schooley, M.S. Thesis, Virginia Polytechnic, pages 9-11 (pages 16-18 of the pdf)
- Door County Well Monitoring Program - Fall 2019 Summary by the UW Oshkosh Environmental Research and Innovation Center, December 9–10, 2019, p. 35 and RR Sites Map, Wisconsin DNR Remediation and Redevelopment
- Door County Comprehensive and Farmland Preservation Plan 2035: Volume II, Resource Report, Chapter 5: Economic Development p. 89 (p. 31 of the pdf)
- Web-Map of Door County, Wisconsin ... For All Seasons!, Door County Land Information Office, Accessed September 7th, 2019
- Groundwater Quality Viewer, UW-Stevens Point, College of Natural Resources, Groundwater Center
- A Case Study of Atmospheric Dry Deposition by Jim J. Lin, Department of Life Sciences, National Air University, Tapeii, 1998
- Atmospheric Deposition of PCBs into Green Bay (link to abstract), Journal of Great Lakes Research Volume 19, Issue 1, 1993, pp. 109–123, authors: Clyde W. Sweet, Thomas J. Murphy, James H. Bannasch, Cynthia A. Kelsey, and John Hong
- Wisconsin Finds 240 More Impaired Waterways by Jackson Parr, Peninsula Pulse – November 22nd, 2017
- White, D., & Cromartie, E. (1977). Residues of Environmental Pollutants and Shell Thinning in Merganser Eggs. The Wilson Bulletin, 89(4), pages 537–540
- Association between PCBs, Liver Lesions, and Biomarker Responses in Adult Walleye (Stizostedium vitreum vitreum) Collected from Green Bay, Wisconsin by Mace G. Barron, Michael Anderson, Doug Beltman, Tracy Podrabsky, William Walsh, Dave Cacela, and Josh Lipton, April 13, 1999, Journal of Great Lakes Research 3, p. 11 (p. 12 of the pdf)
- Keith, J. (1966). Table 2: Reproductive success of Larus argentatus on page 61 of Reproduction in a Population of Herring Gulls (Larus argentatus) Contaminated by DDT. Journal of Applied Ecology 3, 57–70. doi:10.2307/2401445
- Door County Avian Waste Survey by Colleen McDermott, UW-Oshkosh, co.door.wi.us, pp. 11 and 13, Archived December 7, 2015
- Wisconsin Beach Advisories on the Wisconsin Beach Health website; counties are located in the dropdown menu
- Detection of escherichia coli in northern Lake Michigan waters using QPCR method C by Roland Hernandez Jr, May 2018, M.S. thesis, UW-Oshkosh
- Evaluation of Avian Waste and Bird Counts as Predicators of Escherichia coli Contamination at Door County, Wisconsin Beaches by Gregory T. Kleinheinz, Colleen M. McDermott, and Vinni Chomeau, J. Great Lakes Res. 32:117–123 Internat. Assoc. Great Lakes Res., 2006
- Impact of Rainfall on Escherichia Coli Concentrations at Beaches in Door County, Wisconsin, Amanda M. Griesbach, unpublished M.S thesis, University of Wisconsin-Oshkosh, 2013
- Implementation of BMP’s at Beaches to Improve Water Quality, Final Report, Door County Soil & Water Conservation Department, March 29, 2016
- Seasonal stability of Cladophora-associated Salmonella in Lake Michigan watersheds by Muruleedhara N. Byappanahalli, Richard Sawdey, Satoshi Ishii, Dawn A. Shivelya, John A. Ferguson, Richard L. Whitman, and Michael J. Sadowsky, Water Research 43(2009), pp. 806–814
- State of the Bay Report 2013 by Theresa Qualls, H.J. (Bud) Harris, and Victoria Harris; land use data and analysis on page 84 provided by Peter Wolter of Iowa State University for the University of Wisconsin Sea Grant Institute, The State of the Bay The Condition of the Bay of Green Bay/Lake Michigan 2013, page 84
- County of Door 2019 Annual Reports, page 26
- Chapter 6. Invasive species and wetland management from the Wetland Restoration Handbook, Wisconsin DNR, pages 70 and 72 (pages 13 and 15 of the pdf)
- Salting our freshwater lakes by Hilary A. Dugan, Sarah L. Bartlett, Samantha M. Burke, Jonathan P. Doubek, Flora E. Krivak-Tetley, Nicholas K. Skaff, Jamie C. Summers, Kaitlin J. Farrell, Ian M. McCullough, Ana M. Morales-Williams, Derek C. Roberts, Zutao Ouyang, Facundo Scordo, Paul C. Hanson, and Kathleen C. Weathers, Proceedings of the National Academy of Sciences, April 2017, 201620211; doi: 10.1073/pnas.1620211114
- USDA NASS Quick Stats database results for chemical expenditures, 1997 through 2017
- USDA NASS Quick Stats database results for fertilizer expenditures, 1997 through 2017
- Valuing a Spatially Variable Environmental Resource: Reducing Non-Point Source Pollution in Green Bay, WI by Rebecca Moore, Bill Provencher and Richard C. Bishop, University of Wisconsin-Madison Department of Agricultural & Applied Economics, Staff Paper No. 538, May 2009
- No trespassing in the Dairy Gateway: boundary work in deliberative cooperation in Wisconsin, USA by Tamara Metze, Working Paper for ECPR Joint Sessions, April 2006, p. 4
External links
- Lead and Arsenic in Soil at Old Fruit Orchards: Frequently Asked Questions, January 2012, Wisconsin DATCP
- EPA air-quality concerns reach Door County, January 31, 2017, USA-Today Network-Wisconsin
- Door County gets 'F' in American Lung Association annual report, April 27, 2018, Green Bay Press Gazette
- Administrator Wheeler Announces Cleaner Air in Sheboygan and Door Counties, Wisconsin, June 16, 2020, EPA News Releases
- Monitor move shows county air quality good, July 1, 2020, Sheboygan Beacon
- Door County's High Pollution, August 1, 2000, WTMJ Milwaukee 2:42 segment, mirrored on msn.com lifestyle