Richlandtown, Pennsylvania
Richlandtown is a borough in Bucks County, Pennsylvania, United States. The population was 1,327 at the 2010 census.
Richlandtown, Pennsylvania | |
|---|---|
 Main Street in Richlandtown | |
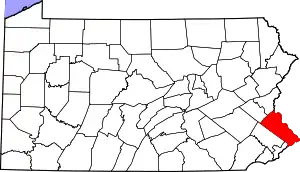
 Location in Bucks County, Pennsylvania | |
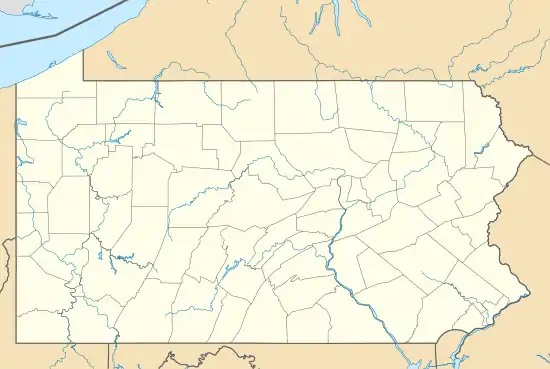 Richlandtown Location in Pennsylvania 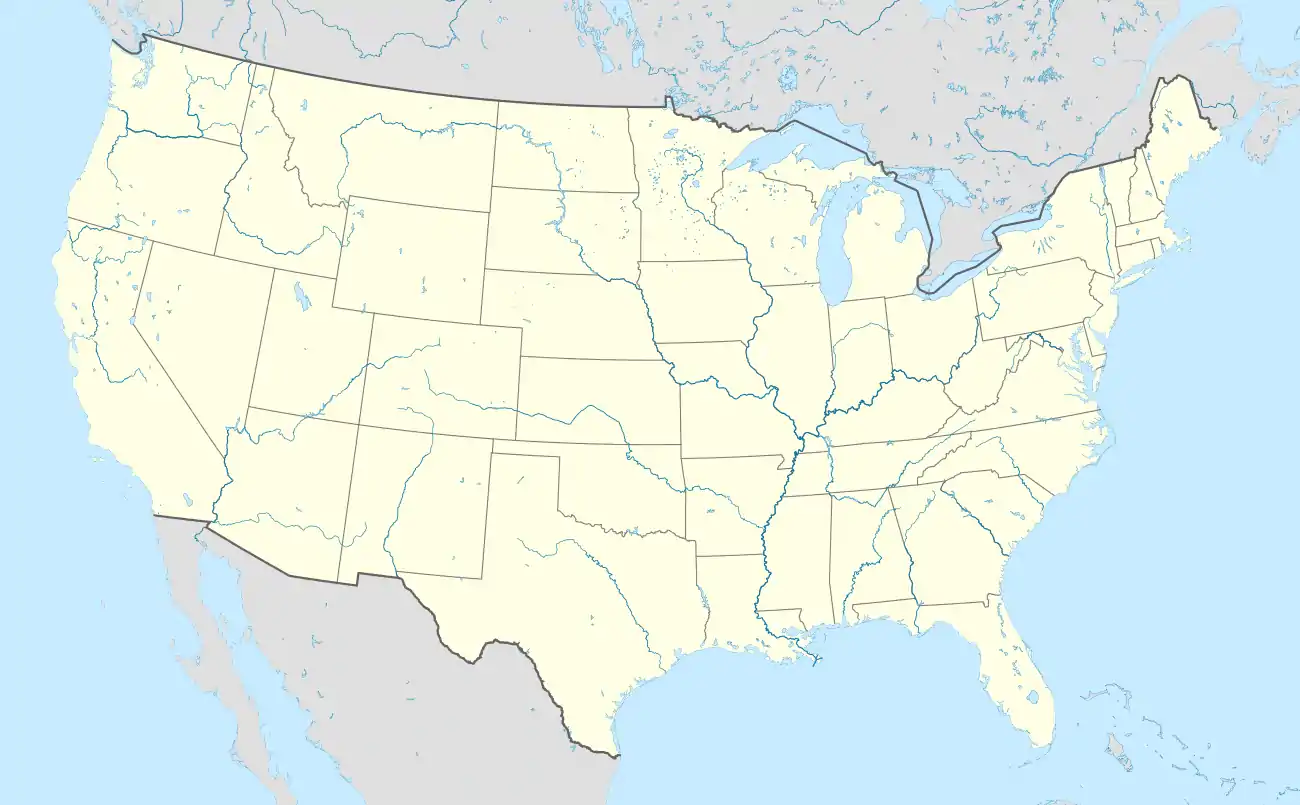 Richlandtown Location in the United States | |
| Coordinates: 40°28′23″N 75°19′17″W | |
| Country | United States |
| State | Pennsylvania |
| County | Bucks |
| Government | |
| • Mayor | James Dunn |
| Area | |
| • Total | 0.26 sq mi (0.67 km2) |
| • Land | 0.26 sq mi (0.67 km2) |
| • Water | 0.00 sq mi (0.00 km2) |
| Elevation | 545 ft (166 m) |
| Population (2010) | |
| • Total | 1,327 |
| • Estimate (2019)[2] | 1,297 |
| • Density | 4,988.46/sq mi (1,923.51/km2) |
| Time zone | UTC-5 (Eastern (EST)) |
| • Summer (DST) | UTC-4 (EDT) |
| ZIP code | 18955 |
| Area code(s) | 215, 267, and 445 |
| FIPS code | 42-64584 |
| Website | www |
Geography
Richlandtown is located at 40°28′23″N 75°19′17″W (40.473184, -75.321523).[3] It is completely surrounded by Richland Township.
According to the United States Census Bureau, the borough has a total area of 0.2 square miles (0.52 km2), all of it land.
Demographics
| Historical population | |||
|---|---|---|---|
| Census | Pop. | %± | |
| 1880 | 272 | — | |
| 1900 | 285 | — | |
| 1910 | 562 | 97.2% | |
| 1920 | 589 | 4.8% | |
| 1930 | 642 | 9.0% | |
| 1940 | 628 | −2.2% | |
| 1950 | 762 | 21.3% | |
| 1960 | 741 | −2.8% | |
| 1970 | 856 | 15.5% | |
| 1980 | 1,180 | 37.9% | |
| 1990 | 1,195 | 1.3% | |
| 2000 | 1,283 | 7.4% | |
| 2010 | 1,327 | 3.4% | |
| 2019 (est.) | 1,297 | [2] | −2.3% |
| Sources:[4][5][6] | |||
As of the census[5] of 2000, there were 1,283 people, 430 households, and 319 families residing in the borough. The population density was 5,034.2 people per square mile (1,981.5/km²). There were 451 housing units at an average density of 1,769.6 per square mile (696.5/km²). The racial makeup of the borough was 98.29% White, 0.39% African American, 0.47% Asian, 0.39% from other races, and 0.47% from two or more races. Hispanic or Latino of any race were 1.25% of the population.
There were 430 households, out of which 41.6% had children under the age of 18 living with them, 54.2% were married couples living together, 13.7% had a female householder with no husband present, and 25.8% were non-families. 22.1% of all households were made up of individuals, and 6.3% had someone living alone who was 65 years of age or older. The average household size was 2.70 and the average family size was 3.13.
In the borough the population was spread out, with 27.2% under the age of 18, 6.2% from 18 to 24, 32.6% from 25 to 44, 16.5% from 45 to 64, and 17.5% who were 65 years of age or older. The median age was 35 years. For every 100 females there were 87.0 males. For every 100 females age 18 and over, there were 78.6 males.
The median income for a household in the borough was $45,652, and the median income for a family was $49,423. Males had a median income of $31,974 versus $25,625 for females. The per capita income for the borough was $19,322. About 1.5% of families and 3.6% of the population were below the poverty line, including 0.9% of those under age 18 and 2.0% of those age 65 or over.
Government and politics
Legislators
- State Representative Craig Staats, Republican, Pennsylvania House of Representatives, District 145
- State Senator Bob Mensch, Republican, Pennsylvania Senate, District 24
- US Representative Brian Fitzpatrick, Republican, Pennsylvania's 1st congressional district
Climate
According to the Köppen climate classification system, Richland has a Hot-summer, Humid continental climate (Dfa). Dfa climates are characterized by at least one month having an average mean temperature ≤ 32.0 °F (0.0 °C), at least four months with an average mean temperature ≥ 50.0 °F (10.0 °C), at least one month with an average mean temperature ≥ 71.6 °F (22.0 °C) and no significant precipitation difference between seasons. Although most summer days are slightly humid in Richland, episodes of heat and high humidity can occur with heat index values > 105 °F (41 °C). Since 1981, the highest air temperature was 102.0 °F (38.9 °C) on 07/22/2011, and the highest daily average mean dew point was 75.6 °F (24.2 °C) on 07/15/1995. Since 1981, the wettest calendar day was 6.12 inches (155 mm) on 09/07/2011. During the winter months, the average annual extreme minimum air temperature is −2.5 °F (−19.2 °C).[7] Since 1981, the coldest air temperature was −16.5 °F (−26.9 °C) on 01/21/1994. Episodes of extreme cold and wind can occur with wind chill values < −13 °F (−25 °C). The average annual snowfall (Nov-Apr) is between 30 inches (76 cm) and 36 inches (91 cm). Ice storms and large snowstorms depositing ≥ 12 inches (30 cm) of snow occur once every few years, particularly during nor’easters from December through February.
| Climate data for Richland, Elevation 499 ft (152 m), 1981-2010 normals, extremes 1981-2018 | |||||||||||||
|---|---|---|---|---|---|---|---|---|---|---|---|---|---|
| Month | Jan | Feb | Mar | Apr | May | Jun | Jul | Aug | Sep | Oct | Nov | Dec | Year |
| Record high °F (°C) | 68.0 (20.0) |
79.4 (26.3) |
86.4 (30.2) |
91.5 (33.1) |
93.6 (34.2) |
95.4 (35.2) |
102.0 (38.9) |
98.5 (36.9) |
95.7 (35.4) |
89.4 (31.9) |
78.5 (25.8) |
72.9 (22.7) |
102.0 (38.9) |
| Average high °F (°C) | 37.5 (3.1) |
40.7 (4.8) |
49.9 (9.9) |
62.0 (16.7) |
72.0 (22.2) |
80.7 (27.1) |
84.8 (29.3) |
83.2 (28.4) |
75.9 (24.4) |
64.7 (18.2) |
53.2 (11.8) |
41.3 (5.2) |
62.3 (16.8) |
| Daily mean °F (°C) | 29.2 (−1.6) |
31.7 (−0.2) |
39.9 (4.4) |
50.7 (10.4) |
60.6 (15.9) |
69.7 (20.9) |
74.0 (23.3) |
72.4 (22.4) |
65.0 (18.3) |
53.6 (12.0) |
43.6 (6.4) |
33.3 (0.7) |
52.1 (11.2) |
| Average low °F (°C) | 21.0 (−6.1) |
22.7 (−5.2) |
29.9 (−1.2) |
39.5 (4.2) |
49.2 (9.6) |
58.8 (14.9) |
63.1 (17.3) |
61.7 (16.5) |
54.1 (12.3) |
42.6 (5.9) |
34.0 (1.1) |
25.3 (−3.7) |
41.9 (5.5) |
| Record low °F (°C) | −16.5 (−26.9) |
−5.7 (−20.9) |
0.8 (−17.3) |
15.5 (−9.2) |
32.5 (0.3) |
39.5 (4.2) |
46.8 (8.2) |
41.2 (5.1) |
34.7 (1.5) |
23.5 (−4.7) |
13.2 (−10.4) |
−3.2 (−19.6) |
−16.5 (−26.9) |
| Average precipitation inches (mm) | 3.08 (78) |
2.70 (69) |
3.64 (92) |
3.85 (98) |
4.07 (103) |
4.32 (110) |
4.04 (103) |
3.41 (87) |
4.13 (105) |
3.81 (97) |
3.69 (94) |
3.49 (89) |
44.23 (1,123) |
| Average relative humidity (%) | 68.4 | 65.9 | 60.2 | 60.0 | 64.3 | 69.3 | 69.5 | 72.1 | 72.9 | 70.9 | 69.8 | 71.3 | 67.9 |
| Average dew point °F (°C) | 20.1 (−6.6) |
21.6 (−5.8) |
27.2 (−2.7) |
37.3 (2.9) |
48.5 (9.2) |
59.2 (15.1) |
63.4 (17.4) |
62.9 (17.2) |
56.1 (13.4) |
44.4 (6.9) |
34.4 (1.3) |
25.0 (−3.9) |
41.8 (5.4) |
| Source: PRISM[8] | |||||||||||||
Ecology
According to the A. W. Kuchler U.S. potential natural vegetation types, Richland would have a dominant vegetation type of Appalachian Oak (104) with a dominant vegetation form of Eastern Hardwood Forest (25).[9] The plant hardiness zone is 6b with an average annual extreme minimum air temperature of −2.5 °F (−19.2 °C).[7] The spring bloom typically begins by April 13 and fall color usually peaks by October 27.
References
- "2019 U.S. Gazetteer Files". United States Census Bureau. Retrieved July 28, 2020.
- "Population and Housing Unit Estimates". United States Census Bureau. May 24, 2020. Retrieved May 27, 2020.
- "US Gazetteer files: 2010, 2000, and 1990". United States Census Bureau. 2011-02-12. Retrieved 2011-04-23.
- "Census of Population and Housing". U.S. Census Bureau. Retrieved 11 December 2013.
- "U.S. Census website". United States Census Bureau. Retrieved 2008-01-31.
- "Incorporated Places and Minor Civil Divisions Datasets: Subcounty Resident Population Estimates: April 1, 2010 to July 1, 2012". Population Estimates. U.S. Census Bureau. Archived from the original on June 11, 2013. Retrieved 11 December 2013.
- "USDA Interactive Plant Hardiness Map". United States Department of Agriculture. Retrieved October 16, 2019.
- "PRISM Climate Group, Oregon State University". Retrieved October 16, 2019.
- "U.S. Potential Natural Vegetation, Original Kuchler Types, v2.0 (Spatially Adjusted to Correct Geometric Distortions)". Retrieved October 16, 2019.
| Authority control |
|---|