Rio Dell, California
Rio Dell (formerly Eagle Prairie, Rio Del, and Wildwood)[6] is a city in Humboldt County, California, United States. It is located on the west bank of the Eel River 1 mile (2 km) north of Scotia[6] at an elevation of 161 feet (49 m).[4] The population was 3,363 at the 2010 census, up from 3,174 at the 2000 census.
Rio Dell, California | |
|---|---|
City | |
| City of Rio Dell | |
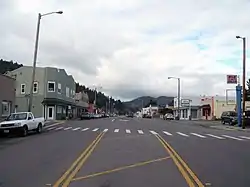
 Wildwood Avenue, Rio Dell | |
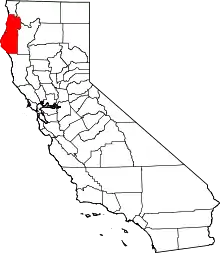
 Location in Humboldt County and the state of California | |
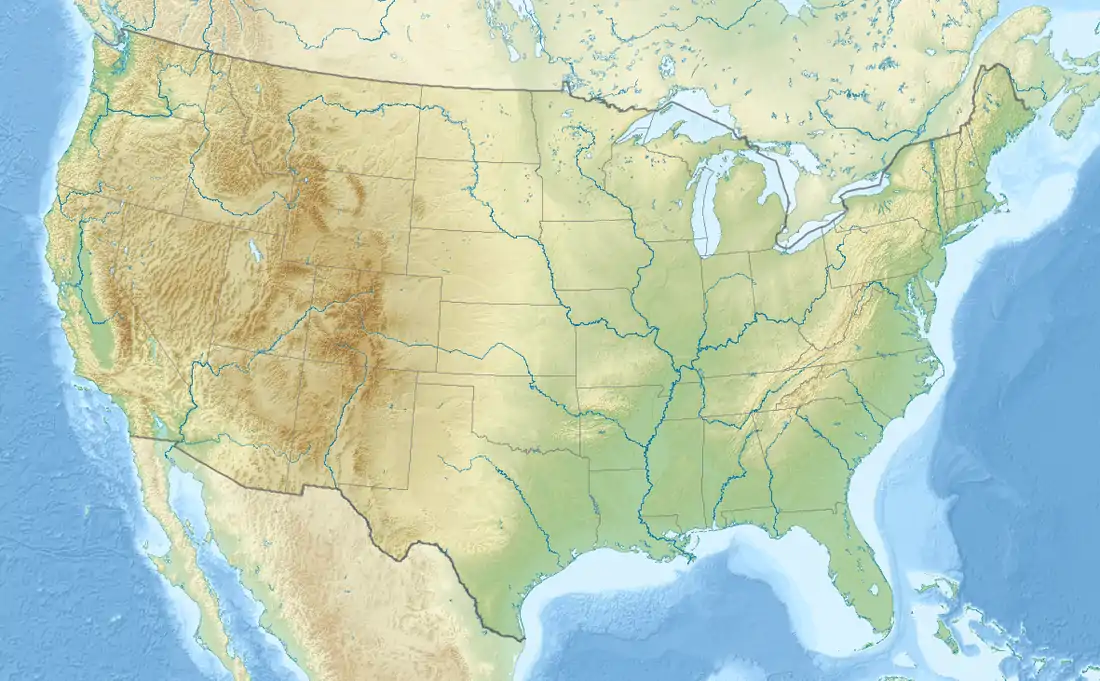
 Rio Dell, California Location in the United States | |
| Coordinates: 40°29′57″N 124°06′23″W | |
| Country | |
| State | |
| County | Humboldt |
| Incorporated | February 23, 1965[1] |
| Government | |
| • Mayor | Debra Garnes[2] |
| Area | |
| • Total | 2.42 sq mi (6.26 km2) |
| • Land | 2.28 sq mi (5.91 km2) |
| • Water | 0.14 sq mi (0.35 km2) 5.61% |
| Elevation | 161 ft (49 m) |
| Population (2010) | |
| • Total | 3,368 |
| • Estimate (2019)[5] | 3,349 |
| • Density | 1,468.22/sq mi (566.86/km2) |
| Time zone | UTC-8 (Pacific (PST)) |
| • Summer (DST) | UTC-7 (PDT) |
| ZIP code | 95562 |
| Area code(s) | 707 |
| FIPS code | 06-60900 |
| GNIS feature IDs | 277614, 2410951 |
| Website | cityofriodell |
Originally settled on the territories of the Wiyot, Nongatl, and Mattole tribes, Rio Dell was reportedly first dubbed "Tokemuk" by native inhabitants of the land who were thought to be of multiple regional tribes and who uniquely spoke at least two different regional languages. The native presence in region faded following the 1860 Wiyot massacre on Indian Island that extended south to the Eel river valley where Rio Dell is located. From there, the area became known as Eagle Prairie and finally as Rio Dell, so named after the settlement's long-established Rio Dell Hotel.[7] Its owner, businessman Lorenzo Painter, devised the name as a merging of Spanish río ("river") and English dell ("small wooded valley").[8]
Geography
According to the United States Census Bureau, the city has a total area of 2.4 square miles (6.2 km2), of which 2.3 square miles (6.0 km2) of it is land and 0.1 square miles (0.26 km2) of it (5.61%) is water.
Climate
This region experiences warm (but not hot) and dry summers, with no average monthly temperatures above 71.6 °F. According to the Köppen Climate Classification system, Rio Dell has a warm-summer Mediterranean climate, abbreviated "Csb" on climate maps.[9]
| Climate data for Rio Dell | |||||||||||||
|---|---|---|---|---|---|---|---|---|---|---|---|---|---|
| Month | Jan | Feb | Mar | Apr | May | Jun | Jul | Aug | Sep | Oct | Nov | Dec | Year |
| Record high °F (°C) | 76 (24) |
82 (28) |
86 (30) |
90 (32) |
97 (36) |
98 (37) |
102 (39) |
96 (36) |
98 (37) |
97 (36) |
81 (27) |
73 (23) |
102 (39) |
| Average high °F (°C) | 55.3 (12.9) |
57.4 (14.1) |
58.5 (14.7) |
60.3 (15.7) |
63.2 (17.3) |
66.3 (19.1) |
69.1 (20.6) |
70.3 (21.3) |
70.9 (21.6) |
67.3 (19.6) |
60.5 (15.8) |
55.6 (13.1) |
62.9 (17.2) |
| Daily mean °F (°C) | 47.8 (8.8) |
49.5 (9.7) |
50.4 (10.2) |
52.3 (11.3) |
55.5 (13.1) |
58.7 (14.8) |
60.9 (16.1) |
61.7 (16.5) |
60.9 (16.1) |
57.6 (14.2) |
52.4 (11.3) |
48.3 (9.1) |
54.7 (12.6) |
| Average low °F (°C) | 40.3 (4.6) |
41.6 (5.3) |
42.6 (5.9) |
44.3 (6.8) |
47.7 (8.7) |
51.1 (10.6) |
52.8 (11.6) |
53.1 (11.7) |
50.9 (10.5) |
47.8 (8.8) |
44.2 (6.8) |
41.1 (5.1) |
46.4 (8.0) |
| Record low °F (°C) | 20 (−7) |
23 (−5) |
29 (−2) |
32 (0) |
33 (1) |
40 (4) |
40 (4) |
41 (5) |
37 (3) |
28 (−2) |
27 (−3) |
17 (−8) |
41 (5) |
| Average precipitation inches (mm) | 8.8 (220) |
7.5 (190) |
6.5 (170) |
3.5 (89) |
1.7 (43) |
0.6 (15) |
0.1 (2.5) |
0.2 (5.1) |
0.6 (15) |
3.0 (76) |
6.4 (160) |
9.2 (230) |
48.1 (1,220) |
| Average precipitation days | 16 | 15 | 15 | 12 | 9 | 5 | 2 | 2 | 3 | 8 | 14 | 16 | 117 |
| Source: [10] | |||||||||||||
History
The first post office at Rio Dell opened in 1876.[6] Rio Dell was connected to Scotia by a ferry provided by the lumber mill in Scotia.[11] After the first bridge was destroyed by a flood in 1905, a ferry carried mill workers from Rio Dell upstream to Scotia, and a second ferry carried mill workers downstream to Metropolitan[12] until a suspension bridge was built to Scotia in 1914.[11] Many Italian immigrants lived in what came to be known as Wildwood, south of Rio Dell proper, and known at the time to outsiders as Little Italy.[12] This part of town became popular with mill workers seeking moonshine, gambling, and prostitution unavailable in the company town of Scotia where they were employed. Men came from as far away as Eureka to enjoy these illegal entertainments, or to engage in recreational fighting, the downtown very soon becoming known as Wildwood. Rio Dell's main street still carries the name Wildwood Avenue. In 1928 buildings on both sides of this street were engulfed by a fire started by a moonshine still.[13] The fire endangered the bridge to Scotia and prevented the Scotia Fire Department from crossing the bridge to help extinguish the fire.[12] Since there was no help forthcoming, many residents took to throwing their bootlegged wine on the fire in a desperate attempt to douse it.
Rio Dell became home to the workforce for one of the largest lumber mills in the world, the Pacific Lumber Company. It was often the first home of immigrants to the United States and Humboldt County, particularly for the young Italian and Portuguese immigrant workforce of the early 20th century. Rio Dell was incorporated in 1965 as a result of changing demographics, a post-war population expansion and the reluctance of the local Sheriff to provide law enforcement services to what was perceived as a dangerous and remote community. The primary benefit of municipal incorporation being a city's ability to create its own armed police department under local control. The department totaled 14 sworn officers shortly after obtaining city status. Following the city's incorporation in 1965 a series of events over the next two decades led to the economic decline of the community, including the opening of a new freeway bypass and the eventual demise of Pacific Lumber Company (Palco) as a significant employer.
Demographics
| Historical population | |||
|---|---|---|---|
| Census | Pop. | %± | |
| 1890 | 213 | — | |
| 1950 | 1,862 | — | |
| 1960 | 3,222 | 73.0% | |
| 1970 | 2,817 | −12.6% | |
| 1980 | 2,687 | −4.6% | |
| 1990 | 3,012 | 12.1% | |
| 2000 | 3,174 | 5.4% | |
| 2010 | 3,368 | 6.1% | |
| 2019 (est.) | 3,349 | [5] | −0.6% |
| U.S. Decennial Census[14] | |||
2010
At the 2010 census Rio Dell had a population of 3,368. The population density was 1,393.2 people per square mile (537.9/km2). The racial makeup of Rio Dell was 2,894 (85.9%) White, 13 (0.4%) African American, 125 (3.7%) Native American, 25 (0.7%) Asian, 3 (0.1%) Pacific Islander, 140 (4.2%) from other races, and 168 (5.0%) from two or more races. Hispanic or Latino of any race were 384 people (11.4%).[15]
The census reported that 3,347 people (99.4% of the population) lived in households, 21 (0.6%) lived in non-institutionalized group quarters, and no one was institutionalized.
There were 1,367 households, 440 (32.2%) had children under the age of 18 living in them, 560 (41.0%) were opposite-sex married couples living together, 199 (14.6%) had a female householder with no husband present, 85 (6.2%) had a male householder with no wife present. There were 131 (9.6%) unmarried opposite-sex partnerships, and 13 (1.0%) same-sex married couples or partnerships. 409 households (29.9%) were one person and 139 (10.2%) had someone living alone who was 65 or older. The average household size was 2.45. There were 844 families (61.7% of households); the average family size was 2.99.
The age distribution was 803 people (23.8%) under the age of 18, 309 people (9.2%) aged 18 to 24, 824 people (24.5%) aged 25 to 44, 989 people (29.4%) aged 45 to 64, and 443 people (13.2%) who were 65 or older. The median age was 38.3 years. For every 100 females, there were 96.7 males. For every 100 females age 18 and over, there were 91.7 males.
There were 1,442 housing units at an average density of 596.5 per square mile (230.3/km2),of which 1,367 were occupied, 774 (56.6%) by the owners and 593 (43.4%) by renters. The homeowner vacancy rate was 0.6%; the rental vacancy rate was 2.8%. 1,952 people (58.0% of the population) lived in owner-occupied housing units and 1,395 people (41.4%) lived in rental housing units.
2000
At the 2000 census there were 3,174 people in 1,221 households, including 830 families, in the city. The population density was 1,684.2 people per square mile (651.9/km2). There were 1,434 housing units at an average density of 760.9 per square mile (294.5/km2). The racial makeup of the city was 85.63% White, 0.16% Black or African American, 3.88% Native American, 0.38% Asian, 0.03% Pacific Islander, 5.73% from other races, and 4.19% from two or more races. 10.81% of the population were Hispanic or Latino of any race.[16] Of the 1,221 households 34.4% had children under the age of 18 living with them, 48.1% were married couples living together, 13.2% had a female householder with no husband present, and 32.0% were non-families. 25.0% of households were one person and 10.4% were one person aged 65 or older. The average household size was 2.59 and the average family size was 3.08.
The age distribution was 28.3% under the age of 18, 9.3% from 18 to 24, 26.5% from 25 to 44, 22.3% from 45 to 64, and 13.6% 65 or older. The median age was 36 years. For every 100 females, there were 98.6 males. For every 100 females age 18 and over, there were 94.8 males.
The median income for a household in the city was $29,254, and the median family income was $36,464. Males had a median income of $30,410 versus $19,688 for females. The per capita income for the city was $12,569. About 18.5% of families and 23.1% of the population were below the poverty line, including 31.1% of those under age 18 and 12.1% of those age 65 or over.
Government
Local government
Rio Dell has a City Council/City Manager form of government. The City Council sets policy, while the City Manager carries out the day-to-day business of the City. The Mayor is selected by the City Council and serves as the presiding officer at city council meetings, and as the official head of the city for legislative and ceremonial purposes.
As of 2019, the Rio Dell City Council consisted of Mayor Debra Garnes, Gordon Johnson, Sue Strahan, Frank Wilson, and Julie Woodall. The City Manager is Kyle Knopp.[17]
State and federal representation
In the state legislature, Rio Dell is in the 2nd Senate District, represented by Democrat Mike McGuire,[18] and the 2nd Assembly District, represented by Democrat Jim Wood.[19]
Federally, Rio Dell is in California's 2nd congressional district, represented by Democrat Jared Huffman.[20]
References
- "California Cities by Incorporation Date". California Association of Local Agency Formation Commissions. Archived from the original (Word) on February 21, 2013. Retrieved April 7, 2013.
- "City Council - City of Rio Dell". cityofriodell.ca.gov. Retrieved December 27, 2019.
- "2019 U.S. Gazetteer Files". United States Census Bureau. Retrieved July 1, 2020.
- U.S. Geological Survey Geographic Names Information System: Rio Dell, California
- "Population and Housing Unit Estimates". United States Census Bureau. May 24, 2020. Retrieved May 27, 2020.
- Durham, David L. (1998). California's Geographic Names: A Gazetteer of Historic and Modern Names of the State. Clovis, Calif.: Word Dancer Press. p. 132. ISBN 1-884995-14-4.
- Garrison, James R. (2015). Scotia and Rio Dell. Arcadia Publishing Inc. pp. 7–8. ISBN 1-4396-5230-9. OCLC 967394417.
- "History of Rio Dell | City of Rio Dell". cityofriodell.ca.gov. Retrieved 2020-06-08.
- Climate Summary for Rio Dell, California
- "Rio Dell, California". Retrieved 3 October 2016.
- Hawk, Diane (2004). Touring the old redwood highway : Humboldt County. Arcata, Calif.: Hawk Mountaintop Pub. p. 104. ISBN 978-0-9672162-4-9.
- Rovai, Julio J. (1979). Rio Dell-(Wildwood) as I saw it in the early twenties. Santa Rosa, California: Julio J. Rovai.
- Garrison, Jim. "The Company's Town: An Examination of the Longevity and Legacy of Scotia, California" (PDF). Humboldt State University. Retrieved 21 August 2019.
- "Census of Population and Housing". Census.gov. Retrieved June 4, 2015.
- "2010 Census Interactive Population Search: CA - Rio Dell city". U.S. Census Bureau. Archived from the original on July 15, 2014. Retrieved July 12, 2014.
- "U.S. Census website". United States Census Bureau. Retrieved 2008-01-31.
- "The Warm Hearted City". City of Rio Dell. Retrieved November 1, 2019.
- "Senators". State of California. Retrieved 10 March 2013.
- "Members Assembly". State of California. Retrieved 2 March 2013.
- "California's 2nd Congressional District - Representatives & District Map". Civic Impulse, LLC. Retrieved March 1, 2013.
