Roussillon Regional County Municipality
Roussillon is a regional county municipality in the Montérégie region of Quebec, Canada. The seat is in Saint-Constant, Quebec. The region's population was 171,443 as of the 2016 census.[3]
Roussillon | |
|---|---|
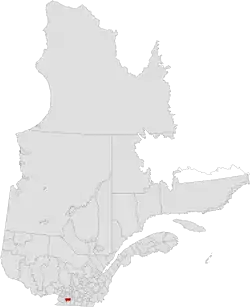 Location in province of Quebec. | |
| Coordinates: 45°22′N 73°34′W[1] | |
| Country | |
| Province | |
| Region | Montérégie |
| Effective | January 1, 1982 |
| Named for | Régiment Royal Roussillon[1] |
| County seat | Saint-Constant |
| Government | |
| • Type | Prefecture |
| • Prefect | Nathalie Simon |
| Area | |
| • Total | 403.60 km2 (155.83 sq mi) |
| • Land | 423.82 km2 (163.64 sq mi) |
| There is an apparent contradiction between two authoritative sources | |
| Population (2016)[3] | |
| • Total | 171,443 |
| • Density | 404.5/km2 (1,048/sq mi) |
| • Change 2011–2016 | |
| Population excludes incompletely enumerated First Nations reserves | |
| Time zone | UTC−5 (EST) |
| • Summer (DST) | UTC−4 (EDT) |
| Area code(s) | 450 and 579 |
| Website | www |
Subdivisions
There are 11 subdivisions and one native reserve within the RCM:[2]
|
|
|
|
Demographics
Population
| Canada census – Roussillon Regional County Municipality community profile | |||
|---|---|---|---|
| 2016 | 2011 | 2006 | |
| Population: | 171,443 (+5.7% from 2011) | 162,187 (+8.1% from 2006) | 149,996 (+8.6% from 2001) |
| Land area: | 423.82 km2 (163.64 sq mi) | 423.24 km2 (163.41 sq mi) | 423.22 km2 (163.41 sq mi) |
| Population density: | 404.5/km2 (1,048/sq mi) | 383.2/km2 (992/sq mi) | 354.4/km2 (918/sq mi) |
| Median age: | 40.6 (M: 39.8, F: 41.4) | 39.5 (M: 38.7, F: 40.2) | 38.5 (M: 37.7, F: 39.2) |
| Total private dwellings: | 67,868 | 63,441 | 57,300 |
| Median household income: | $78,596 | $69,942 | $62,568 |
| References: 2016[4] 2011[5] 2006[6] earlier[7] | |||
|
| ||||||||||||||||||||||||
| [8][9][3] | |||||||||||||||||||||||||
Language
| Canada Census Mother Tongue - Roussillon Regional County Municipality[8] | ||||||||||||||||||
|---|---|---|---|---|---|---|---|---|---|---|---|---|---|---|---|---|---|---|
| Census | Total | French |
English |
French & English |
Other | |||||||||||||
| Year | Responses | Count | Trend | Pop % | Count | Trend | Pop % | Count | Trend | Pop % | Count | Trend | Pop % | |||||
2016 |
170,835 |
131,215 | 76.8% | 19,115 | 11.12% | 2375 | 1.39% | 16,345 | 9.57% | |||||||||
2011 |
160,260 |
127,660 | 79.66% | 18,735 | 11.69% | 2,045 | 1.28% | 11,820 | 7.37% | |||||||||
2006 |
148,560 |
122,345 | 82.35% | 16,545 | 11.14% | 1,080 | 0.73% | 8,590 | 5.78% | |||||||||
2001 |
137,200 |
113,865 | 82.99% | 16,360 | 11.93% | 1,180 | 0.86% | 5,795 | 4.22% | |||||||||
1996 |
130,975 |
107,105 | n/a | 81.78% | 17,080 | n/a | 13.04% | 1,330 | n/a | 1.01% | 5,460 | n/a | 4.17% | |||||
Transportation
Access Routes
Highways and numbered routes that run through the municipality, including external routes that start or finish at the county border:[10]
References
- http://www.toponymie.gouv.qc.ca/ct/ToposWeb/fiche.aspx?no_seq=141041
- Geographic code 670 in the official Répertoire des municipalités (in French)
- "Census Profile, 2016 Census: Roussillon, Municipalité régionale de comté [Census division], Quebec". Statistics Canada. Retrieved November 26, 2019.
- "2016 Community Profiles". 2016 Canadian Census. Statistics Canada. February 21, 2017. Retrieved 2019-11-26.
- "2011 Community Profiles". 2011 Canadian Census. Statistics Canada. July 5, 2013. Retrieved 2014-01-31.
- "2006 Community Profiles". 2006 Canadian Census. Statistics Canada. March 30, 2011. Retrieved 2014-01-31.
- "2001 Community Profiles". 2001 Canadian Census. Statistics Canada. February 17, 2012.
- Statistics Canada: 1996, 2001, 2006, 2011, 2016 census
- "(Code 2467) Census Profile". 2011 census. Statistics Canada. 2012.
- Official Transport Quebec Road Map
Adjacent Counties & Equivalent Territories | |
|---|---|
This article is issued from Wikipedia. The text is licensed under Creative Commons - Attribution - Sharealike. Additional terms may apply for the media files.