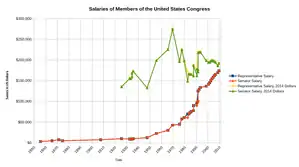
Salaries of members of the United States Congress
This chart shows historical information on the salaries that members of the United States Congress have been paid.[1] The Government Ethics Reform Act of 1989 provides for an automatic increase in salary each year as a cost of living adjustment that reflects the employment cost index.[2] Since 2010 Congress has annually voted not to accept the increase, keeping it at the same nominal amount since 2009. The Twenty-seventh Amendment to the United States Constitution, ratified in 1992, prohibits any law affecting compensation from taking effect until after the next election.
| Year | Salary | Per diem/annum | Percent adjustment | In 2019 dollars |
|---|---|---|---|---|
| 1789 | $50 | per annum | ||
| 1795 | $1 | per diem only Representatives | ||
| $7 | per diem only Senators | |||
| 1796 | $6 | per diem | ||
| 1815 | $1,500 | per annum | $20,954 | |
| 1817 | $6 | per diem only Representatives | $96 | |
| $7 | per diem only Senators | $112 | ||
| 1818 | $8 | per diem | $134 | |
| 1855 | $3,000 | per annum | $82,318 | |
| 1865 | $5,000 | per annum | $83,511 | |
| 1871 | $7,500 | per annum | $160,063 | |
| 1874 | $5,000 | per annum | $112,985 | |
| 1907 | $7,500 | per annum | $205,795 | |
| 1925 | $10,000 | per annum | $145,787 | |
| 1932 | $9,000 | per annum | $168,651 | |
| 1933 | $8,500 | per annum | $167,880 | |
| 1934 (2/1) | $9,000 | per annum | $172,007 | |
| 1934 (7/1) | $9,500 | per annum | $181,563 | |
| 1935 | $10,000 | per annum | $186,481 | |
| 1947 | $12,500 | per annum | $143,126 | |
| 1955 | $22,500 | per annum | $214,742 | |
| 1965 | $30,000 | per annum | $243,390 | |
| 1969 | $42,500 | per annum | $296,304 | |
| 1975 | $44,600 | per annum | $211,912 | |
| 1977 | $57,500 | per annum | $242,599 | |
| 1979 | $60,662.50 | per annum | $213,696 | |
| 1982 | $69,800 | per annum only Representatives | $184,922 | |
| 1983 | $69,800 | per annum only Senators | $179,176 | |
| 1984 | $72,600 | per annum | $178,663 | |
| 1985 | $75,100 | per annum | $178,525 | |
| 1987 (1/1) | $77,400 | per annum | $174,184 | |
| 1987 (2/4) | $89,500 | per annum | $201,414 | |
| 1990 (2/1) | $96,600 | per annum only Representatives | $189,042 | |
| 1990 (2/1) | $98,400 | per annum only Senators | $192,564 | |
| 1991 (1/1) | $125,100 | per annum only Representatives | $234,826 | |
| 1991 (1/1) | $101,900 | per annum only Senators | $191,277 | |
| 1991 (8/14) | $125,100 | per annum only Senators | $234,826 | |
| 1992 | $129,500 | per annum | 3.5% | $235,938 |
| 1993 | $133,600 | per annum | 3.2% | $236,454 |
| 1998 | $136,700 | per annum | 2.3% | $214,428 |
| 2000 | $141,300 | per annum | 3.4% | $209,779 |
| 2001 | $145,100 | per annum | 2.7% | $209,510 |
| 2002 | $150,000 | per annum | 3.4% | $213,219 |
| 2003 | $154,700 | per annum | 3.1% | $215,007 |
| 2004 | $158,100 | per annum | 2.2% | $214,003 |
| 2005 | $162,100 | per annum | 2.5% | $212,202 |
| 2006 | $165,200 | per annum | 1.9% | $209,513 |
| 2008 | $169,300 | per annum | 2.5% | $201,040 |
| 2009 | $174,000 | per annum | 2.8% | $207,359 |
| This article is part of a series on the |
| United States Senate |
|---|
 Great Seal of the United States Senate |
| History of the United States Senate |
| Members |
|
| Politics and procedure |
| Places |
| This article is part of a series on the |
| United States House of Representatives |
|---|
 Great Seal of the United States House of Representatives |
|
History of the United States House of Representatives |
| Members |
|
|
| Politics and procedure |
| Places |
Additional pay schedule for the Senate and House positions:
SCHEDULE 6—VICE PRESIDENT AND MEMBERS OF CONGRESS[3]
| Position | Salary |
|---|---|
| Vice President | $255,800 |
| Senators and House Representatives | $174,000 |
| Resident Commissioner from Puerto Rico | $174,000 |
| President pro tempore of the Senate | $193,400 |
| Majority leader and minority leader of the Senate | $193,400 |
| Majority leader and minority leader of the House of Representatives | $193,400 |
| Speaker of the House of Representatives | $223,500 |
References
- Brudnick, Ida A. (April 11, 2018). Salaries of Members of Congress: Recent Actions and Historical Tables (PDF). Washington, DC: Congressional Research Service. Retrieved 18 April 2018.
- "Do Members of Congress get Automatic Pay Hikes (COLAs)?". National Taxpayers Union. Retrieved 2018-08-02.
- Executive Order 13970 of December 31, 2020, Adjustments of Certain Rates of Pay. Executive Order for 2021 Pay Schedules
https://www.senate.gov/CRSpubs/9c14ec69-c4e4-4bd8-8953-f73daa1640e4.pdf