Tynemouth (UK Parliament constituency)
Tynemouth is a constituency[n 1] represented in the House of Commons of the UK Parliament since 1997 by Alan Campbell, a member of the Labour Party.[n 2]
| Tynemouth | |
|---|---|
| Borough constituency for the House of Commons | |
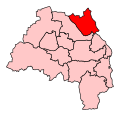 Boundary of Tynemouth in Tyne and Wear | |
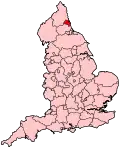 Location of Tyne and Wear within England | |
| County | Tyne and Wear |
| Electorate | 76,618 (December 2010)[1] |
| Major settlements | North Shields, Whitley Bay, Monkseaton, Tynemouth and Cullercoats |
| Current constituency | |
| Created | 1885 |
| Member of Parliament | Alan Campbell (Labour) |
| Number of members | One |
| Created from | Tynemouth and North Shields |
Boundaries
1918–1950: The County Borough of Tynemouth.
1950–1983: The County Borough of Tynemouth, and the Urban District of Whitley Bay.
1983–1997: The Borough of North Tyneside wards of Chirton, Collingwood, Cullercoats, Monkseaton, North Shields, Riverside, St Mary's, Seatonville, Tynemouth, and Whitley Bay.
1997–2010: The Borough of North Tyneside wards of Chirton, Collingwood, Cullercoats, Monkseaton, North Shields, St Mary's, Seatonville, Tynemouth, and Whitley Bay.
2010–present: The Borough of North Tyneside wards of Chirton, Collingwood, Cullercoats, Monkseaton North, Monkseaton South, Preston, St Mary's, Tynemouth, Valley, and Whitley Bay.
The seat covers Tynemouth, North Shields, Whitley Bay, Cullercoats, Monkseaton, and since 2010 Shiremoor and Backworth.
History
The constituency was created under the Redistribution of Seats Act 1885.
- Political history
The seat has historically shown the highest level of support for the Conservative Party in the Tyne and Wear area, with the Conservatives holding the seat for 47 years from 1950-1997; though sometimes with only narrow majorities. However, since the 1997 general election, it has been represented by Alan Campbell of the Labour Party
- Prominent frontbenchers
The present member, Alan Campbell reached the level of government below a Minister of State in 2008, as a Parliamentary Under-Secretary of State for the Home Office.
Constituency profile
A coastal seat on the northern bank of the River Tyne. North Shields and the communities along the Tyne itself tend to be more industrial and working-class, once dominated by coal mining and shipbuilding. The coastal towns to the north, such as Whitley Bay, tend to be more middle-class dormitory towns for Newcastle commuters.
This has tended to be one of the more Conservative-leaning seats in the North East of England, where the party has traditionally struggled against the Labour Party. As a relatively middle-class area, it returned Conservative MPs from 1950-1997; albeit often on narrow majorities. It has been represented by Labour since 1997, though the Conservatives remain strong at a local level. Similar to Sefton Central on Merseyside, despite being a traditionally strong Conservative area in a Labour-dominated county, the area has swung significantly to Labour during the twenty-first century, and has been won by semi-marginal to safe margins by Labour candidates at every general election since 1997, with significant swings to Labour seen in both 2015 and 2017.
Workless claimants, registered jobseekers, were in November 2012 close to the national average of 3.8%, at 3.9% of the population based on a statistical compilation by The Guardian, lower than the regional average by 0.5%.[2]
Members of Parliament
- Constituency created (1885)
| Election | Member[3] | Party | Notes | |
|---|---|---|---|---|
| 1885 | Richard Donkin | Conservative | ||
| 1900 | Frederick Leverton Harris | Conservative | Later MP for Stepney and East Worcestershire | |
| 1906 | Herbert James Craig | Liberal | ||
| 1918 | Charles Percy | Conservative | ||
| 1922 | Alexander Russell | Conservative | ||
| 1945 | Grace Colman | Labour | ||
| 1950 | Irene Ward | Conservative | Represented Wallsend 1931-1945 | |
| Feb 1974 | Neville Trotter | Conservative | ||
| 1997 | Alan Campbell | Labour | ||
Elections
Elections in the 2010s
| Party | Candidate | Votes | % | ±% | |
|---|---|---|---|---|---|
| Labour | Alan Campbell | 26,928 | 48.0 | ||
| Conservative | Lewis Bartoli | 22,071 | 39.4 | ||
| Liberal Democrats | John Appleby | 3,791 | 6.8 | ||
| Brexit Party | Ed Punchard | 1,963 | 3.5 | New | |
| Green | Julia Erskine | 1,281 | 2.3 | ||
| Majority | 4,857 | 8.6 | |||
| Turnout | 56,034 | 72.5 | |||
| Labour hold | Swing | ||||
| Party | Candidate | Votes | % | ±% | |
|---|---|---|---|---|---|
| Labour | Alan Campbell | 32,395 | 57.0 | ||
| Conservative | Nick Varley | 20,729 | 36.5 | ||
| Liberal Democrats | John Appleby | 1,724 | 3.0 | ||
| UKIP | Stuart Haughton | 1,257 | 2.2 | ||
| Green | Julia Erskine[7] | 629 | 1.1 | ||
| Independent | Anthony "The Durham Cobbler" Jull | 124 | 0.2 | New | |
| Majority | 11,666 | 20.5 | |||
| Turnout | 56,858 | 74.5 | |||
| Labour hold | Swing | ||||
| Party | Candidate | Votes | % | ±% | |
|---|---|---|---|---|---|
| Labour | Alan Campbell | 25,791 | 48.2 | ||
| Conservative | Glenn Hall[9] | 17,551 | 32.8 | ||
| UKIP | Gary Legg[10] | 6,541 | 12.2 | ||
| Green | Julia Erskine[11] | 2,017 | 3.8 | ||
| Liberal Democrats | John Paton-Day[12] | 1,595 | 3.0 | ||
| Majority | 8,240 | 15.4 | |||
| Turnout | 53,495 | 69.0 | |||
| Labour hold | Swing | ||||
For the 2010 election, this was the primary target seat for the Conservatives in North East England following impressive local council victories since 2006 and the recent marginality of Alan Campbell's 2005 re-election. However, they failed to take the seat and any of its surrounding seats, which remained Labour.
| Party | Candidate | Votes | % | ±% | |
|---|---|---|---|---|---|
| Labour | Alan Campbell | 23,860 | 45.3 | ||
| Conservative | Wendy Morton | 18,121 | 34.4 | ||
| Liberal Democrats | John Appleby | 7,845 | 14.9 | ||
| BNP | Dorothy Brooke | 1,404 | 2.7 | New | |
| UKIP | Natasha Payne | 900 | 1.7 | New | |
| Green | Julia Erskine | 538 | 1.0 | New | |
| Majority | 5,739 | 10.9 | |||
| Turnout | 52,668 | 69.6 | |||
| Labour hold | Swing | ||||
Elections in the 2000s
Michael McIntyre was councillor for the Whitley Bay Ward at the time of polling. The Conservatives hoped to snatch the seat, but could only diminish Alan Campbell's majority. In the Mayoral election held on the same day, Mayor Linda Arkley (Conservative) narrowly lost re-election.
| Party | Candidate | Votes | % | ±% | |
|---|---|---|---|---|---|
| Labour | Alan Campbell | 20,143 | 47.0 | ||
| Conservative | Michael McIntyre | 16,000 | 37.3 | ||
| Liberal Democrats | Colin Finlay | 6,716 | 15.7 | ||
| Majority | 4,143 | 9.7 | |||
| Turnout | 42,859 | 66.9 | |||
| Labour hold | Swing | ||||
Labour MP Alan Campbell was returned in 2001 with a smaller majority on the back of Tony Blair's second landslide.
| Party | Candidate | Votes | % | ±% | |
|---|---|---|---|---|---|
| Labour | Alan Campbell | 23,364 | 53.2 | ||
| Conservative | Karl Poulsen | 14,686 | 33.5 | ||
| Liberal Democrats | Penny Reid | 5,108 | 11.6 | ||
| UKIP | Michael Rollings | 745 | 1.7 | ||
| Majority | 8,678 | 19.7 | |||
| Turnout | 43,903 | 67.4 | |||
| Labour hold | Swing | ||||
Elections in the 1990s
In 1997 Labour won their largest Tynemouth majority ever. The Conservatives chose Gateshead Councillor Martin Callanan as their candidate to replace the retiring Neville Trotter. He would subsequently become a North East MEP and later a peer.
| Party | Candidate | Votes | % | ±% | |
|---|---|---|---|---|---|
| Labour | Alan Campbell | 28,318 | 55.4 | +10.4 | |
| Conservative | Martin Callanan | 17,045 | 33.3 | -12.7 | |
| Liberal Democrats | Andrew Duffield | 4,509 | 8.8 | +0.7 | |
| Referendum | Clive Rook | 819 | 1.6 | New | |
| UKIP | Frank Rogers | 462 | 0.9 | New | |
| Majority | 11,273 | 22.1 | N/A | ||
| Turnout | 51,153 | 77.11 | −3.3 | ||
| Labour gain from Conservative | Swing | +11.5 | |||
In 1992 Neville Trotter narrowly won his final term as the Labour candidate's fourth attempt failed. Many council seats were also unexpectedly won on the back of John Major's victory such as Whitley Bay and Monkseaton.
| Party | Candidate | Votes | % | ±% | |
|---|---|---|---|---|---|
| Conservative | Neville Trotter | 27,731 | 46.0 | +2.8 | |
| Labour | Patrick Cosgrove | 27,134 | 45.0 | +6.2 | |
| Liberal Democrats | Philip J.S. Selby | 4,855 | 8.1 | −9.9 | |
| Green | Andrew Buchanan-Smith | 543 | 0.9 | New | |
| Majority | 597 | 1.0 | −3.4 | ||
| Turnout | 60,263 | 80.4 | +2.3 | ||
| Conservative hold | Swing | −1.7 | |||
Elections in the 1980s
| Party | Candidate | Votes | % | ±% | |
|---|---|---|---|---|---|
| Conservative | Neville Trotter | 25,113 | 43.2 | -4.9 | |
| Labour | Patrick Cosgrove | 22,530 | 38.8 | +7.5 | |
| Liberal | David Mayhew | 10,446 | 18.0 | -2.1 | |
| Majority | 2,583 | 4.4 | -12.8 | ||
| Turnout | 58,089 | 78.1 | +3.5 | ||
| Conservative hold | Swing | -6.42 | |||
1983: Neville Trotter's biggest majority on the back of Mrs. Thatcher's landslide.
| Party | Candidate | Votes | % | ±% | |
|---|---|---|---|---|---|
| Conservative | Neville Trotter | 27,029 | 48.1 | -3.5 | |
| Labour | Patrick Cosgrove | 17,420 | 31.3 | -7.2 | |
| Liberal | D.F. Mayhew | 11,153 | 20.1 | +10.3 | |
| Majority | 9,609 | 17.2 | +4.2 | ||
| Turnout | 55.602 | 74.6 | -3.1 | ||
| Conservative hold | Swing | +2.0 | |||
Elections in the 1970s
1979: Patrick 'Paddy' Cosgrove's first of four attempts to win the seat. Cosgrove was the Labour councillor for Whitley Bay Ward.
| Party | Candidate | Votes | % | ±% | |
|---|---|---|---|---|---|
| Conservative | Neville Trotter | 29,941 | 51.57 | ||
| Labour | Patrick Joseph Cosgrove[n 3] | 22,377 | 38.55 | ||
| Liberal | R. Pinkney | 5,736 | 9.88 | ||
| Majority | 7,564 | 13.02 | |||
| Turnout | 58,054 | 77.69 | |||
| Conservative hold | Swing | ||||
| Party | Candidate | Votes | % | ±% | |
|---|---|---|---|---|---|
| Conservative | Neville Trotter | 24,510 | 43.16 | ||
| Labour | J.E. Miller | 21,389 | 37.66 | ||
| Liberal | Rodney S. Turner | 10,895 | 19.18 | ||
| Majority | 3,121 | 5.50 | |||
| Turnout | 56,794 | 74.29 | |||
| Conservative hold | Swing | ||||
February 1974: Neville Trotter, a Newcastle City Councillor and Chartered Accountant, becomes MP.
| Party | Candidate | Votes | % | ±% | |
|---|---|---|---|---|---|
| Conservative | Neville Trotter | 26,824 | 44.22 | ||
| Labour | D. Carlton | 20,437 | 33.69 | ||
| Liberal | Rodney S. Turner | 13,393 | 22.08 | ||
| Majority | 6,387 | 10.53 | |||
| Turnout | 60,654 | 80.02 | |||
| Conservative hold | Swing | ||||
1970: Jeremy Beecham would later become leader of Newcastle City Council and a Peer.
| Party | Candidate | Votes | % | ±% | |
|---|---|---|---|---|---|
| Conservative | Irene Ward | 30,773 | 51.36 | ||
| Labour | Jeremy Beecham | 23,927 | 39.93 | ||
| Liberal | Rodney S. Turner | 5,221 | 8.71 | New | |
| Majority | 6,846 | 11.43 | |||
| Turnout | 59,921 | 75.85 | |||
| Conservative hold | Swing | ||||
Elections in the 1960s
1966: Gordon Adam would latterly become a North East MEP and make a failed bid to become Elected Mayor of North Tyneside in 2001.
| Party | Candidate | Votes | % | ±% | |
|---|---|---|---|---|---|
| Conservative | Irene Ward | 29,210 | 49.62 | ||
| Labour | Gordon Adam | 25,814 | 43.85 | ||
| Independent | James C. Edwards | 3,846 | 6.53 | New | |
| Majority | 3,396 | 5.77 | |||
| Turnout | 58,870 | 78.45 | |||
| Conservative hold | Swing | ||||
| Party | Candidate | Votes | % | ±% | |
|---|---|---|---|---|---|
| Conservative | Irene Ward | 33,342 | 56.29 | ||
| Labour | Albert Booth | 25,894 | 43.71 | ||
| Majority | 7,448 | 12.58 | |||
| Turnout | 59,236 | 78.96 | |||
| Conservative hold | Swing | ||||
Elections in the 1950s
| Party | Candidate | Votes | % | ±% | |
|---|---|---|---|---|---|
| Conservative | Irene Ward | 32,810 | 56.37 | ||
| Labour | William H. Hutchinson | 18,866 | 32.42 | ||
| Liberal | David N. Thompson | 6,525 | 11.21 | ||
| Majority | 13,994 | 23.95 | |||
| Turnout | 58,201 | 80.53 | |||
| Conservative hold | Swing | ||||
| Party | Candidate | Votes | % | ±% | |
|---|---|---|---|---|---|
| Conservative | Irene Ward | 30,949 | 55.12 | ||
| Labour | James Finegan | 20,113 | 35.82 | ||
| Liberal | Roy Cairncross | 5,082 | 9.05 | New | |
| Majority | 10,836 | 19.30 | |||
| Turnout | 56,144 | 79.35 | |||
| Conservative hold | Swing | ||||
| Party | Candidate | Votes | % | ±% | |
|---|---|---|---|---|---|
| Conservative | Irene Ward | 33,800 | 56.39 | ||
| Labour | Grace Colman | 26,144 | 43.61 | ||
| Majority | 7,656 | 12.78 | |||
| Turnout | 59,944 | 84.54 | |||
| Conservative hold | Swing | ||||
| Party | Candidate | Votes | % | ±% | |
|---|---|---|---|---|---|
| Conservative | Irene Ward | 28,785 | 49.30 | ||
| Labour | Grace Colman | 23,148 | 39.65 | ||
| Liberal | E.B. Slack | 6,452 | 11.05 | ||
| Majority | 5,637 | 9.65 | |||
| Turnout | 58,385 | 84.01 | |||
| Conservative gain from Labour | Swing | ||||
Elections in the 1940s
| Party | Candidate | Votes | % | ±% | |
|---|---|---|---|---|---|
| Labour | Grace Colman | 13,963 | 46.07 | ||
| Conservative | Alexander Russell | 10,884 | 35.91 | ||
| Liberal | Kenneth Paterson Chitty | 5,460 | 18.02 | ||
| Majority | 3,079 | 10.16 | N/A | ||
| Turnout | 30,307 | 76.85 | |||
| Labour gain from Conservative | Swing | ||||
Elections in the 1930s
| Party | Candidate | Votes | % | ±% | |
|---|---|---|---|---|---|
| Conservative | Alexander Russell | 16,003 | 47.1 | -4.7 | |
| Labour | Samuel Segal | 10,145 | 29.8 | +6.0 | |
| Liberal | John Stanley Holmes | 7,868 | 23.1 | -1.3 | |
| Majority | 5,858 | 17.3 | -10.1 | ||
| Turnout | 34,016 | 79.22 | -4.9 | ||
| Conservative hold | Swing | ||||
| Party | Candidate | Votes | % | ±% | |
|---|---|---|---|---|---|
| Conservative | Alexander Russell | 17,607 | 51.8 | +14.8 | |
| Liberal | John Stanley Holmes | 8,295 | 24.4 | -8.7 | |
| Labour | T.H. Knight | 8,110 | 23.8 | -6.1 | |
| Majority | 9,312 | 27.38 | +23.5 | ||
| Turnout | 34,012 | 84.15 | +0.8 | ||
| Conservative hold | Swing | ||||
Elections in the 1920s
| Party | Candidate | Votes | % | ±% | |
|---|---|---|---|---|---|
| Unionist | Alexander Russell | 11,785 | 37.0 | -8.2 | |
| Liberal | Richard Irvin | 10,545 | 33.1 | +5.7 | |
| Labour | John Stuart Barr | 9,503 | 29.9 | +2.5 | |
| Majority | 1,240 | 3.9 | -13.9 | ||
| Turnout | 31,833 | 83.3 | -1.3 | ||
| Unionist hold | Swing | -7.0 | |||
| Party | Candidate | Votes | % | ±% | |
|---|---|---|---|---|---|
| Unionist | Alexander Russell | 11,210 | 45.2 | +4.2 | |
| Liberal | Harry Barnes | 6,820 | 27.4 | -10.9 | |
| Labour | John Stuart Barr | 6,818 | 27.4 | +6.7 | |
| Majority | 4,390 | 17.8 | +15.1 | ||
| Turnout | 24,848 | 84.6 | +3.5 | ||
| Unionist hold | Swing | +7.5 | |||
| Party | Candidate | Votes | % | ±% | |
|---|---|---|---|---|---|
| Unionist | Alexander Russell | 9,612 | 41.0 | -7.1 | |
| Liberal | Harry Barnes | 9,008 | 38.3 | +9.3 | |
| Labour | W. Pitt | 4,875 | 20.7 | -2.2 | |
| Majority | 604 | 2.7 | -16.4 | ||
| Turnout | 23,495 | 81.1 | -2.4 | ||
| Unionist hold | Swing | -8.2 | |||
| Party | Candidate | Votes | % | ±% | |
|---|---|---|---|---|---|
| Unionist | Alexander Russell | 11.244 | 48.1 | +13.4 | |
| Liberal | Herbert Craig | 6,787 | 29.0 | -3.2 | |
| Labour | George Harold Humphrey | 5,362 | 22.9 | +7.7 | |
| Majority | 4,457 | 19.1 | +16.6 | ||
| Turnout | 23,393 | 83.5 | +19.7 | ||
| Unionist hold | Swing | +8.4 | |||
Elections in the 1910s

| Party | Candidate | Votes | % | ±% | |
|---|---|---|---|---|---|
| C | Unionist | Charles Percy | 5,883 | 34.7 | −14.2 |
| Liberal | Herbert Craig | 5,434 | 32.2 | −18.9 | |
| Independent Labour | George Harold Humphrey | 2,566 | 15.2 | New | |
| Independent | Henry Gregg (British politician) | 2,495 | 14.8 | New | |
| National | Dixon Scott | 517 | 3.1 | New | |
| Majority | 449 | 2.5 | N/A | ||
| Turnout | 16,895 | 63.8 | −15.6 | ||
| Unionist gain from Liberal | Swing | +2.4 | |||
| C indicates candidate endorsed by the coalition government. | |||||
1918: Dixon Scott was the founder of Newcastle's 'News Cinema', the modern 'Tyneside Cinema'.
| Party | Candidate | Votes | % | ±% | |
|---|---|---|---|---|---|
| Liberal | Herbert Craig | 4,106 | 51.1 | −1.8 | |
| Conservative | Charles Percy | 3,939 | 48.9 | +1.8 | |
| Majority | 177 | 2.2 | −3.6 | ||
| Turnout | 8,045 | 79.4 | -3.9 | ||
| Registered electors | 10,122 | ||||
| Liberal hold | Swing | −1.8 | |||
| Party | Candidate | Votes | % | ±% | |
|---|---|---|---|---|---|
| Liberal | Herbert Craig | 4,487 | 52.9 | −2.0 | |
| Conservative | Edward George Spencer-Churchill[24] | 3,993 | 47.1 | +2.0 | |
| Majority | 494 | 5.8 | −4.0 | ||
| Turnout | 8,480 | 83.3 | -3.3 | ||
| Registered electors | 10,122 | ||||
| Liberal hold | Swing | −2.0 | |||
Elections in the 1900s
| Party | Candidate | Votes | % | ±% | |
|---|---|---|---|---|---|
| Liberal | Herbert Craig | 4,286 | 54.9 | +8.0 | |
| Conservative | Frederick Leverton Harris | 3,522 | 45.1 | −8.0 | |
| Majority | 764 | 9.8 | N/A | ||
| Turnout | 7,808 | 86.6 | +4.6 | ||
| Registered electors | 9,019 | ||||
| Liberal gain from Conservative | Swing | +8.0 | |||
| Party | Candidate | Votes | % | ±% | |
|---|---|---|---|---|---|
| Conservative | Frederick Leverton Harris[25] | 3,501 | 53.1 | +1.4 | |
| Liberal | F.D. Blake | 3,094 | 46.9 | −1.4 | |
| Majority | 407 | 6.2 | +2.8 | ||
| Turnout | 6,595 | 82.0 | +2.0 | ||
| Registered electors | 8,041 | ||||
| Conservative hold | Swing | +1.4 | |||
Elections in the 1890s
| Party | Candidate | Votes | % | ±% | |
|---|---|---|---|---|---|
| Conservative | Richard Donkin | 3,168 | 51.7 | −1.2 | |
| Liberal | Francis Blake[26] | 2,959 | 48.3 | +1.2 | |
| Majority | 209 | 3.4 | −2.4 | ||
| Turnout | 6,127 | 80.0 | −0.9 | ||
| Registered electors | 7,659 | ||||
| Conservative hold | Swing | −1.2 | |||
| Party | Candidate | Votes | % | ±% | |
|---|---|---|---|---|---|
| Conservative | Richard Donkin | 3,121 | 52.9 | −2.2 | |
| Liberal | James Annand | 2,783 | 47.1 | +2.2 | |
| Majority | 338 | 5.8 | −4.4 | ||
| Turnout | 5,904 | 80.9 | +4.8 | ||
| Registered electors | 7,300 | ||||
| Conservative hold | Swing | −2.2 | |||
Elections in the 1880s
| Party | Candidate | Votes | % | ±% | |
|---|---|---|---|---|---|
| Conservative | Richard Donkin | 2,795 | 55.1 | −2.1 | |
| Liberal | William Thomas Raymond[27] | 2,277 | 44.9 | +2.1 | |
| Majority | 518 | 10.2 | −4.2 | ||
| Turnout | 5,072 | 76.1 | −3.3 | ||
| Registered electors | 6,669 | ||||
| Conservative hold | Swing | −2.1 | |||
| Party | Candidate | Votes | % | ±% | |
|---|---|---|---|---|---|
| Conservative | Richard Donkin | 3,027 | 57.2 | ||
| Liberal | Joseph Spence[28] | 2,269 | 42.8 | ||
| Majority | 758 | 14.4 | |||
| Turnout | 5,296 | 79.4 | |||
| Registered electors | 6,669 | ||||
| Conservative win (new seat) | |||||
Notes and references
- Notes
- A borough constituency (for the purposes of election expenses and type of returning officer)
- As with all constituencies, the constituency elects one Member of Parliament (MP) by the first past the post system of election at least every five years.
- Cosgrove was a Whitley Bay councillor and leading North East barrister
- References
- "Electorate Figures - Boundary Commission for England". 2011 Electorate Figures. Boundary Commission for England. 4 March 2011. Archived from the original on 6 November 2010. Retrieved 13 March 2011.
- Unemployment claimants by constituency The Guardian
- Leigh Rayment's Historical List of MPs – Constituencies beginning with "T" (part 2)
- "Tynemouth Parliamentary constituency". BBC News. BBC. Retrieved 24 November 2019.
- http://my.northtyneside.gov.uk/sites/default/files/web-page-related-files/Comined%20NOP%20-%20Tynemouth.pdf
- "Tynemouth". BBC News. Retrieved 9 June 2017.
- "North Tyneside Borough Green Party". www.facebook.com.
- "Election Data 2015". Electoral Calculus. Archived from the original on 17 October 2015. Retrieved 17 October 2015.
- "Tunbridge Wells councillor to stand for Parliament - 320 miles away". 2 September 2014.
- "UK Polling Report". ukpollingreport.co.uk.
- http://northtynesidegreenparty.webs.com/
- "List of selected candidates". Liberal Democrats. 4 March 2015. Retrieved 14 March 2015.
- "Election Data 2010". Electoral Calculus. Archived from the original on 26 July 2013. Retrieved 17 October 2015.
- "North Tyneside Council: Website unavailable". www.northtyneside.gov.uk.
- "Election Data 2005". Electoral Calculus. Archived from the original on 15 October 2011. Retrieved 18 October 2015.
- "Election Data 2001". Electoral Calculus. Archived from the original on 15 October 2011. Retrieved 18 October 2015.
- "Election Data 1997". Electoral Calculus. Archived from the original on 15 October 2011. Retrieved 18 October 2015.
- "Election Data 1992". Electoral Calculus. Archived from the original on 15 October 2011. Retrieved 18 October 2015.
- "Politics Resources". Election 1992. Politics Resources. 9 April 1992. Retrieved 2010-12-06.
- "Election Data 1987". Electoral Calculus. Archived from the original on 15 October 2011. Retrieved 18 October 2015.
- "Election Data 1983". Electoral Calculus. Archived from the original on 15 October 2011. Retrieved 18 October 2015.
- British Parliamentary Election Results 1918-1949, FWS Craig
- Craig, FWS, ed. (1974). British Parliamentary Election Results: 1885-1918. London: Macmillan Press. ISBN 9781349022984.
- Gwynne, Howell Arthur. "Captain Edward George Spencer-Churchill". Retrieved 15 October 2017.
- Frederick Leverton-Harris (1864-1926) Obituary in The Times, Tuesday, 16 November 1926; pg. 16; Issue 44430; col B
- "The Representation of Tynemouth". Shields Daily Gazette. 10 Apr 1895. p. 3. Retrieved 22 November 2017.
- "Borough Tynemouth Parliamentary Election". Shields Daily News. 23 June 1886. p. 2. Retrieved 14 December 2017 – via British Newspaper Archive.
- "Mr Joseph Spence for Tynemouth". Shields Daily Gazette. 9 October 1885. p. 3. Retrieved 14 December 2017 – via British Newspaper Archive.