Vandans
Vandans is a town located in the Bludenz district in the Austrian state of Vorarlberg. Located 650 m (2133 ft) above sea level, it is known for its skiing and hiking activities.
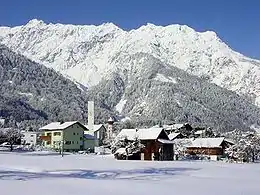
Vandans in winter
Vandans | |
|---|---|
 | |
 Coat of arms | |
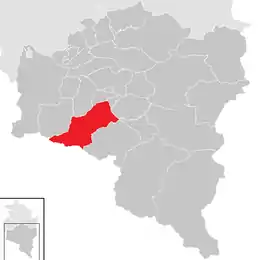 Location in the district | |
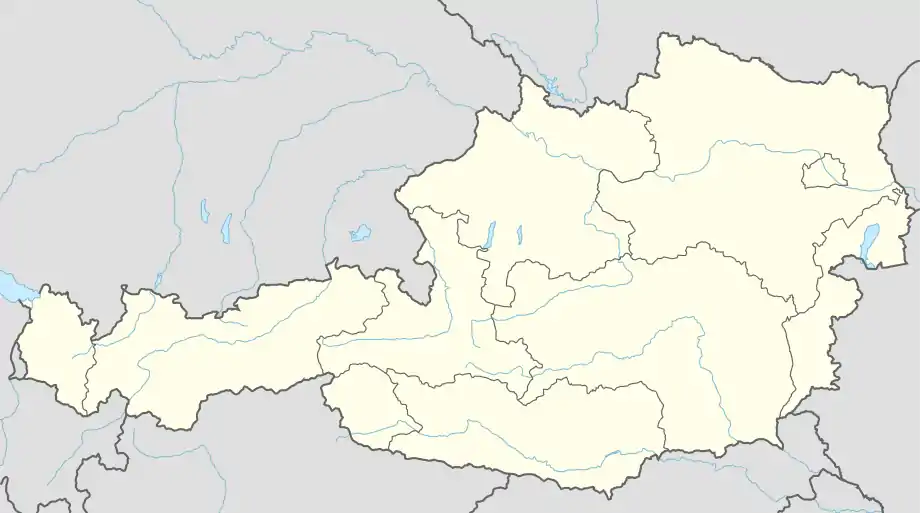 Vandans Location within Austria | |
| Coordinates: 47°05′43″N 09°51′56″E | |
| Country | Austria |
| State | Vorarlberg |
| District | Bludenz |
| Government | |
| • Mayor | Florian Küng |
| Area | |
| • Total | 53.44 km2 (20.63 sq mi) |
| Elevation | 660 m (2,170 ft) |
| Population (2018-01-01)[2] | |
| • Total | 2,636 |
| • Density | 49/km2 (130/sq mi) |
| Time zone | UTC+1 (CET) |
| • Summer (DST) | UTC+2 (CEST) |
| Postal code | 6773 |
| Area code | 05556 |
| Vehicle registration | BZ |
| Website | www.vandans.at |
Population
| Year | Pop. | ±% |
|---|---|---|
| 1869 | 711 | — |
| 1880 | 690 | −3.0% |
| 1890 | 625 | −9.4% |
| 1900 | 641 | +2.6% |
| 1910 | 652 | +1.7% |
| 1923 | 697 | +6.9% |
| 1934 | 874 | +25.4% |
| 1939 | 825 | −5.6% |
| 1951 | 1,169 | +41.7% |
| 1961 | 1,546 | +32.2% |
| 1971 | 1,828 | +18.2% |
| 1981 | 2,033 | +11.2% |
| 1991 | 2,311 | +13.7% |
| 2001 | 2,638 | +14.1% |
| 2011 | 2,605 | −1.3% |
Climate
| Climate data for Vandans (1981–2010) | |||||||||||||
|---|---|---|---|---|---|---|---|---|---|---|---|---|---|
| Month | Jan | Feb | Mar | Apr | May | Jun | Jul | Aug | Sep | Oct | Nov | Dec | Year |
| Record high °C (°F) | 16.5 (61.7) |
19.7 (67.5) |
23.6 (74.5) |
26.2 (79.2) |
30.8 (87.4) |
33.4 (92.1) |
35.4 (95.7) |
36.3 (97.3) |
29.1 (84.4) |
27.1 (80.8) |
23.8 (74.8) |
19.7 (67.5) |
36.3 (97.3) |
| Average high °C (°F) | 3.1 (37.6) |
4.9 (40.8) |
9.8 (49.6) |
14.3 (57.7) |
19.2 (66.6) |
21.6 (70.9) |
23.6 (74.5) |
22.9 (73.2) |
18.9 (66.0) |
14.7 (58.5) |
7.5 (45.5) |
3.4 (38.1) |
13.7 (56.7) |
| Daily mean °C (°F) | −1.1 (30.0) |
−0.2 (31.6) |
3.7 (38.7) |
7.9 (46.2) |
12.7 (54.9) |
15.3 (59.5) |
17.2 (63.0) |
16.5 (61.7) |
12.8 (55.0) |
8.7 (47.7) |
3.0 (37.4) |
−0.3 (31.5) |
8.0 (46.4) |
| Average low °C (°F) | −4.1 (24.6) |
−3.5 (25.7) |
−0.1 (31.8) |
3.1 (37.6) |
7.3 (45.1) |
10.1 (50.2) |
12.1 (53.8) |
11.9 (53.4) |
8.8 (47.8) |
5.1 (41.2) |
0.1 (32.2) |
−3.0 (26.6) |
4.0 (39.2) |
| Record low °C (°F) | −23.9 (−11.0) |
−18.2 (−0.8) |
−16.7 (1.9) |
−7.3 (18.9) |
−2.0 (28.4) |
0.5 (32.9) |
4.2 (39.6) |
3.5 (38.3) |
−0.7 (30.7) |
−7.9 (17.8) |
−13.1 (8.4) |
−14.9 (5.2) |
−23.9 (−11.0) |
| Average precipitation mm (inches) | 96 (3.8) |
88 (3.5) |
105 (4.1) |
93 (3.7) |
116 (4.6) |
156 (6.1) |
173 (6.8) |
171 (6.7) |
129 (5.1) |
89 (3.5) |
104 (4.1) |
109 (4.3) |
1,430 (56.3) |
| Average relative humidity (%) (at 14:00) | 73.8 | 65.0 | 56.0 | 50.5 | 52.4 | 56.4 | 57.6 | 60.4 | 64.0 | 66.3 | 74.2 | 77.8 | 62.9 |
| Mean monthly sunshine hours | 44 | 82 | 132 | 157 | 183 | 180 | 209 | 196 | 162 | 119 | 55 | 29 | 1,548 |
| Percent possible sunshine | 48.3 | 53.0 | 47.4 | 47.9 | 49.9 | 49.4 | 55.9 | 55.6 | 53.8 | 56.4 | 44.1 | 45.1 | 50.6 |
| Source: Central Institute for Meteorology and Geodynamics[3][4][5][6][7] | |||||||||||||
| Climate data for Vandans (1971–2000) | |||||||||||||
|---|---|---|---|---|---|---|---|---|---|---|---|---|---|
| Month | Jan | Feb | Mar | Apr | May | Jun | Jul | Aug | Sep | Oct | Nov | Dec | Year |
| Record high °C (°F) | 16.5 (61.7) |
19.7 (67.5) |
23.6 (74.5) |
25.6 (78.1) |
30.1 (86.2) |
32.2 (90.0) |
35.4 (95.7) |
33.0 (91.4) |
29.1 (84.4) |
27.1 (80.8) |
23.8 (74.8) |
19.7 (67.5) |
35.4 (95.7) |
| Average high °C (°F) | 2.8 (37.0) |
4.7 (40.5) |
9.5 (49.1) |
13.6 (56.5) |
18.6 (65.5) |
20.7 (69.3) |
23.0 (73.4) |
22.7 (72.9) |
18.9 (66.0) |
14.4 (57.9) |
7.3 (45.1) |
3.6 (38.5) |
13.3 (55.9) |
| Daily mean °C (°F) | −1.4 (29.5) |
−0.3 (31.5) |
3.6 (38.5) |
7.3 (45.1) |
12.1 (53.8) |
14.6 (58.3) |
16.7 (62.1) |
16.3 (61.3) |
12.7 (54.9) |
8.5 (47.3) |
2.7 (36.9) |
−0.1 (31.8) |
7.7 (45.9) |
| Average low °C (°F) | −4.5 (23.9) |
−3.7 (25.3) |
−0.2 (31.6) |
2.7 (36.9) |
6.8 (44.2) |
9.6 (49.3) |
11.8 (53.2) |
11.7 (53.1) |
8.6 (47.5) |
4.9 (40.8) |
−0.3 (31.5) |
−3.0 (26.6) |
3.7 (38.7) |
| Record low °C (°F) | −23.9 (−11.0) |
−18.2 (−0.8) |
−12.3 (9.9) |
−5.3 (22.5) |
−3.5 (25.7) |
0.5 (32.9) |
4.2 (39.6) |
3.5 (38.3) |
−0.7 (30.7) |
−6.7 (19.9) |
−15.4 (4.3) |
−14.8 (5.4) |
−23.9 (−11.0) |
| Average precipitation mm (inches) | 97.0 (3.82) |
89.1 (3.51) |
109.7 (4.32) |
96.7 (3.81) |
116.4 (4.58) |
162.8 (6.41) |
181.1 (7.13) |
164.6 (6.48) |
129.8 (5.11) |
87.8 (3.46) |
99.8 (3.93) |
112.8 (4.44) |
1,447.6 (56.99) |
| Average snowfall cm (inches) | 55.9 (22.0) |
53.4 (21.0) |
39.7 (15.6) |
11.1 (4.4) |
1.2 (0.5) |
0.0 (0.0) |
0.0 (0.0) |
0.0 (0.0) |
0.4 (0.2) |
0.1 (0.0) |
22.6 (8.9) |
47.9 (18.9) |
232.3 (91.5) |
| Average precipitation days (≥ 1.0 mm) | 11.3 | 10.0 | 13.0 | 11.8 | 13.5 | 15.6 | 15.0 | 13.9 | 11.6 | 9.9 | 10.8 | 11.8 | 148.2 |
| Average relative humidity (%) (at 14:00) | 73.3 | 64.6 | 55.9 | 49.9 | 51.7 | 56.3 | 56.9 | 58.9 | 62.3 | 65.0 | 72.7 | 77.0 | 62.0 |
| Mean monthly sunshine hours | 42.6 | 82.0 | 126.6 | 150.2 | 180.7 | 159.7 | 199.5 | 192.0 | 164.6 | 116.4 | 55.2 | 28.9 | 1,498.4 |
| Percent possible sunshine | 50.0 | 51.8 | 45.5 | 45.8 | 48.5 | 44.2 | 54.2 | 54.5 | 54.1 | 54.0 | 44.8 | 46.1 | 49.5 |
| Source: Central Institute for Meteorology and Geodynamics[8] | |||||||||||||
References
- "Dauersiedlungsraum der Gemeinden Politischen Bezirke und Bundesländer - Gebietsstand 1.1.2018". Statistics Austria. Retrieved 10 March 2019.
- "Einwohnerzahl 1.1.2018 nach Gemeinden mit Status, Gebietsstand 1.1.2018". Statistics Austria. Retrieved 9 March 2019.
- "Klimamittel 1981–2010: Lufttemperatur" (in German). Central Institute for Meteorology and Geodynamics. Archived from the original on 21 October 2019. Retrieved 19 November 2019.
- "Klimamittel 1981–2010: Niederschlag" (in German). Central Institute for Meteorology and Geodynamics. Archived from the original on 29 December 2014. Retrieved 19 November 2019.
- "Klimamittel 1981–2010: Schnee" (in German). Central Institute for Meteorology and Geodynamics. Archived from the original on 29 December 2014. Retrieved 19 November 2019.
- "Klimamittel 1981–2010: Luftfeuchtigkeit" (in German). Central Institute for Meteorology and Geodynamics. Archived from the original on 21 October 2019. Retrieved 19 November 2019.
- "Klimamittel 1981–2010: Strahlung" (in German). Central Institute for Meteorology and Geodynamics. Archived from the original on 29 December 2014. Retrieved 19 November 2019.
- "Klimadaten von Österreich 1971–2000 – Vorarlberg-Vandas" (in German). Central Institute for Meteorology and Geodynamics. Archived from the original on 12 October 2019. Retrieved 19 November 2019.
External links
| Vandans | ||||||||||||||||||||||||||||||||||||||||||||||||||||||||||||
|---|---|---|---|---|---|---|---|---|---|---|---|---|---|---|---|---|---|---|---|---|---|---|---|---|---|---|---|---|---|---|---|---|---|---|---|---|---|---|---|---|---|---|---|---|---|---|---|---|---|---|---|---|---|---|---|---|---|---|---|---|
| Climate chart (explanation) | ||||||||||||||||||||||||||||||||||||||||||||||||||||||||||||
| ||||||||||||||||||||||||||||||||||||||||||||||||||||||||||||
| ||||||||||||||||||||||||||||||||||||||||||||||||||||||||||||
| Wikimedia Commons has media related to Vandans. |
This article is issued from Wikipedia. The text is licensed under Creative Commons - Attribution - Sharealike. Additional terms may apply for the media files.