Werra-Meißner – Hersfeld-Rotenburg
Werra-Meißner – Hersfeld-Rotenburg is an electoral constituency (German: Wahlkreis) represented in the Bundestag. It elects one member via first-past-the-post voting. Under the current constituency numbering system, it is designated as constituency 169. It is located in northern Hesse, comprising the Werra-Meißner-Kreis and Hersfeld-Rotenburg districts.[1]
| 169 Werra-Meißner – Hersfeld-Rotenburg | |
|---|---|
| electoral district for the Bundestag | |
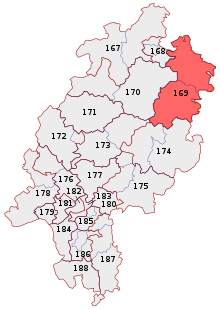 Werra-Meißner – Hersfeld-Rotenburg in 2013 | |
| State | Hesse |
| Population | 221,900 (2015) |
| Electorate | 175,992 (2017) |
| Major settlements | Bad Hersfeld Eschwege Witzenhausen |
| Area | 2,121.8 km2 |
| Current electoral district | |
| Created | 2002 |
| Party | SPD |
| Member | Michael Roth |
| Elected | 2002, 2005, 2009, 2013, 2017 |
Werra-Meißner – Hersfeld-Rotenburg was created for the 2002 federal election. Since 2002, it has been represented by Michael Roth of the Social Democratic Party (SPD).[2]
Geography
Werra-Meißner – Hersfeld-Rotenburg is located in northern Hesse. As of the 2021 federal election, it comprises the Werra-Meißner-Kreis and Hersfeld-Rotenburg districts.[1]
History
Werra-Meißner – Hersfeld-Rotenburg was created in 2002 and contained parts of the abolished constituencies of Hersfeld amd Werra-Meißner. In the 2002 election, it was named Werra-Meißner – Hersfeld. It acquired its current name in the 2005 election. In the 2002 and 2005 elections, it was constituency 171 in the numbering system. In the 2009 election, it was number 170. Since 2013, it has been number 169. Its borders have not changed since its creation.
| Election | No. | Name | Borders |
|---|---|---|---|
| 2002 | 171 | Werra-Meißner – Hersfeld |
|
| 2005 | Werra-Meißner – Hersfeld-Rotenburg | ||
| 2009 | 170 | ||
| 2013 | 169 | ||
| 2017 | |||
| 2021 |
Members
The constituency has been represented by Michael Roth of the Social Democratic Party (SPD) since its creation.
| Election | Member | Party | % | |
|---|---|---|---|---|
| 2002 | Michael Roth | SPD | 54.9 | |
| 2005 | 51.7 | |||
| 2009 | 40.4 | |||
| 2013 | 43.1 | |||
| 2017 | 41.2 | |||
Election results
2017 election
| Federal election (2017): Werra-Meißner – Hersfeld-Rotenburg[3] | |||||||||
|---|---|---|---|---|---|---|---|---|---|
| Notes: |
Blue background denotes the winner of the electorate vote.
| ||||||||
| Party | Candidate | Votes | % | ±% | Party votes | % | ±% | ||
| SPD | 54,033 | 41.2 | 42,737 | 32.6 | |||||
| CDU | Timo Lübeck | 39,302 | 29.9 | 38,531 | 29.4 | ||||
| AfD | Stefan Wild | 16,411 | 12.5 | 17,173 | 13.1 | ||||
| Left | Sabine Leidig | 7,281 | 5.5 | 8,746 | 6.7 | ||||
| FDP | Manfred Lister | 6,594 | 5.0 | 11,096 | 8.5 | ||||
| Green | Martina Selzer | 5,236 | 4.0 | 7,843 | 6.0 | ||||
| FW | Emmanuel Anyangwe Ngassa | 2,375 | 1.8 | 1,229 | 0.9 | ||||
| Tierschutzpartei | 1,031 | 0.8 | |||||||
| PARTEI | 854 | 0.7 | |||||||
| NPD | 608 | 0.5 | |||||||
| Pirates | 430 | 0.3 | |||||||
| DM | 210 | 0.2 | |||||||
| BGE | 202 | 0.2 | |||||||
| V-Partei³ | 147 | 0.1 | |||||||
| ÖDP | 135 | 0.1 | |||||||
| MLPD | 35 | 0.0 | |||||||
| DKP | 33 | 0.0 | |||||||
| BüSo | 27 | 0.0 | |||||||
| Informal votes | 2,494 | 2,659 | |||||||
| Total Valid votes | 131,232 | 131,067 | |||||||
| Turnout | 133,726 | 76.0 | |||||||
| SPD hold | Majority | 14,731 | 11.3 | ||||||
2013 election
| Federal election (2013): Werra-Meißner – Hersfeld-Rotenburg[4] | |||||||||
|---|---|---|---|---|---|---|---|---|---|
| Notes: |
Blue background denotes the winner of the electorate vote.
| ||||||||
| Party | Candidate | Votes | % | ±% | Party votes | % | ±% | ||
| SPD | 54,630 | 43.1 | 46,913 | 36.9 | |||||
| CDU | Helmut Heiderich | 51,386 | 40.5 | 45,872 | 36.0 | ||||
| Left | Johanna Scheringer-Wright | 7,277 | 5.7 | 7,584 | 6.0 | ||||
| Green | Armin Jung | 6,333 | 5.0 | 8,868 | 7.0 | ||||
| AfD | 7,096 | 5.6 | |||||||
| FDP | Manfred Lister | 2,513 | 2.0 | 5,014 | 3.9 | ||||
| NPD | Gisela Lück | 2,392 | 1.9 | 2,013 | 1.6 | ||||
| Pirates | Michael Balke | 2,283 | 1.8 | 1,954 | 1.5 | ||||
| FW | 961 | 0.8 | |||||||
| PARTEI | 521 | 0.4 | |||||||
| REP | 170 | 0.1 | |||||||
| PRO | 136 | 0.1 | |||||||
| BüSo | 55 | 0.0 | |||||||
| PSG | 55 | 0.0 | |||||||
| MLPD | 41 | 0.0 | |||||||
| Informal votes | 4,632 | 4,193 | |||||||
| Total Valid votes | 126,814 | 127,253 | |||||||
| Turnout | 131,446 | 72.9 | |||||||
| SPD hold | Majority | 3,244 | 2.6 | ||||||
2009 election
| Federal election (2009): Werra-Meißner – Hersfeld-Rotenburg[5] | |||||||||
|---|---|---|---|---|---|---|---|---|---|
| Notes: |
Blue background denotes the winner of the electorate vote.
| ||||||||
| Party | Candidate | Votes | % | ±% | Party votes | % | ±% | ||
| SPD | 53,275 | 40.4 | 45,401 | 34.4 | |||||
| CDU | Helmut Heiderich[lower-alpha 1] | 45,711 | 34.6 | 39,966 | 30.3 | ||||
| FDP | Thomas Fehling | 12,290 | 9.3 | 17,526 | 13.3 | ||||
| Left | Mareike Zingsem | 11,080 | 8.4 | 12,927 | 9.8 | ||||
| Green | Philipp Schmagold | 7,530 | 5.7 | 10,679 | 8.1 | ||||
| Pirates | 1,948 | 1.5 | |||||||
| NPD | Konrad Bentz | 2,128 | 1.6 | 1,939 | 1.5 | ||||
| Tierschutzpartei | 1,004 | 0.8 | |||||||
| REP | 422 | 0.3 | |||||||
| BüSo | 155 | 0.1 | |||||||
| DVU | 95 | 0.1 | |||||||
| MLPD | 35 | 0.0 | |||||||
| Informal votes | 3,713 | 3,630 | |||||||
| Total Valid votes | 132,014 | 132,097 | |||||||
| Turnout | 135,727 | 73.6 | |||||||
| SPD hold | Majority | 7,564 | 5.8 | ||||||
Notes
- Heiderich entered the Bundestag on the CDU list after the resignation of Holger Haibach in March 2011.
References
- "Constituency Werra-Meißner – Hersfeld-Rotenburg". Federal Returning Officer.
- "Results for Werra-Meißner – Hersfeld-Rotenburg". Federal Returning Officer.
- Results for Werra-Meißner – Hersfeld-Rotenburg
- Results for Werra-Meißner – Hersfeld-Rotenburg
- Results for Werra-Meißner – Hersfeld-Rotenburg
| Current | |
|---|---|
| Other states |
|
| See also | |
