Marburg (electoral district)
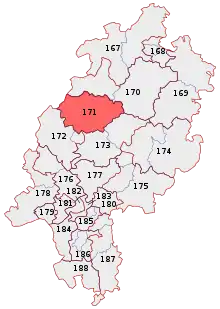
Marburg is an electoral constituency (German: Wahlkreis) represented in the Bundestag. It elects one member via first-past-the-post voting. Under the current constituency numbering system, it is designated as constituency 171. It is located in northern Hesse, comprising the Marburg-Biedenkopf district.[1]
| 171 Marburg | |
|---|---|
| electoral district for the Bundestag | |
 Marburg in 2013 | |
| State | Hesse |
| Population | 245,200 (2015) |
| Electorate | 183,296 (2017) |
| Major settlements | Marburg Stadtallendorf Kirchhain |
| Area | 1,262.5 km2 |
| Current electoral district | |
| Created | 1949 |
| Party | SPD |
| Member | Sören Bartol |
| Elected | 2002, 2005, 2009, 2013, 2017 |
Marburg was created for the inaugural 1949 federal election. Since 2002, it has been represented by Sören Bartol of the Social Democratic Party (SPD).[2]
Geography
Marburg is located in northern Hesse. As of the 2021 federal election, it is coterminous with the Marburg-Biedenkopf district.[1]
History
Marburg was created in 1949. In the 1949 election, it was Hesse constituency 6 in the numbering system. In the 1953 through 1976 elections, it was number 131. From 1980 through 1998, it was number 129. In 2002 and 2005, it was number 173. In the 2009 election, it was number 172. Since 2013, it has been number 171.
Originally, the constituency comprised the independent city of Marburg and the districts of Biedenkopf and Landkreis Marburg. In the 1965 election, it lost the municipality of Schiffelbach from the Landkreis Marburg district. It acquired its current borders in the 1976 election.
| Election | No. | Name | Borders |
|---|---|---|---|
| 1949 | 6 | Marburg |
|
| 1953 | 131 | ||
| 1957 | |||
| 1961 | |||
| 1965 |
| ||
| 1969 | |||
| 1972 | |||
| 1976 |
| ||
| 1980 | 129 | ||
| 1983 | |||
| 1987 | |||
| 1990 | |||
| 1994 | |||
| 1998 | |||
| 2002 | 173 | ||
| 2005 | |||
| 2009 | 172 | ||
| 2013 | 171 | ||
| 2017 | |||
| 2021 |
Members
The constituency was first represented by Ludwig Preiß from 1949 to 1961. In the 1949 and 1953 elections, he represented by Free Democratic Party (FDP); in 1957, he was elected for the German Party (DP). Gerhard Jahn of the Social Democratic Party (SPD) was elected in 1961, but former member Preiß won the constituency in 1965, this time representing the Christian Democratic Union (CDU). Jahn was elected again in 1969 and served until 1983. Friedrich Bohl of the CDU was elected in 1983 and was representative until 1994. Brigitte Lange regained the constituency for the SPD in 1994, and served until 2002. Sören Bartol was elected in 2002, and re-elected in 2005, 2009, 2013, and 2017.
| Election | Member | Party | % | |
|---|---|---|---|---|
| 1949 | Ludwig Preiß | FDP | 36.2 | |
| 1953 | 33.6 | |||
| 1957 | DP | 41.9 | ||
| 1961 | Gerhard Jahn | SPD | 41.5 | |
| 1965 | Ludwig Preiß | CDU | 44.9 | |
| 1969 | Gerhard Jahn | SPD | 49.2 | |
| 1972 | 53.4 | |||
| 1976 | 47.3 | |||
| 1980 | 49.6 | |||
| 1983 | Friedrich Bohl | CDU | 47.6 | |
| 1987 | 43.6 | |||
| 1990 | 42.3 | |||
| 1994 | Brigitte Lange | SPD | 43.1 | |
| 1998 | 47.7 | |||
| 2002 | Sören Bartol | SPD | 47.8 | |
| 2005 | 47.5 | |||
| 2009 | 38.9 | |||
| 2013 | 43.7 | |||
| 2017 | 35.7 | |||
Election results
2017 election
| Federal election (2017): Marburg[3] | |||||||||
|---|---|---|---|---|---|---|---|---|---|
| Notes: |
Blue background denotes the winner of the electorate vote.
| ||||||||
| Party | Candidate | Votes | % | ±% | Party votes | % | ±% | ||
| SPD | 50,214 | 35.7 | 37,202 | 26.4 | |||||
| CDU | Stefan Heck | 46,888 | 33.4 | 42,377 | 30.1 | ||||
| AfD | Julian Schmidt | 14,378 | 10.2 | 16,125 | 11.5 | ||||
| Left | Elisabeth Kula | 11,557 | 8.2 | 14,420 | 10.2 | ||||
| Green | Rainer Flohrschütz | 8,989 | 6.4 | 13,088 | 9.3 | ||||
| FDP | Hanke Friedrich Bokelmann | 6,044 | 4.3 | 12,191 | 8.7 | ||||
| PARTEI | 1,296 | 0.9 | |||||||
| Tierschutzpartei | 1,148 | 0.8 | |||||||
| FW | Daniel Baron | 2,005 | 1.4 | 950 | 0.7 | ||||
| Pirates | 527 | 0.4 | |||||||
| Independent | Rainer Schmidtke | 491 | 0.3 | ||||||
| NPD | 357 | 0.3 | |||||||
| ÖDP | 312 | 0.2 | |||||||
| BGE | 297 | 0.2 | |||||||
| DM | 180 | 0.1 | |||||||
| V-Partei³ | 174 | 0.1 | |||||||
| DKP | 64 | 0.0 | |||||||
| MLPD | 45 | 0.0 | |||||||
| BüSo | 33 | 0.0 | |||||||
| Informal votes | 1,799 | 1,579 | |||||||
| Total Valid votes | 140,566 | 140,786 | |||||||
| Turnout | 142,365 | 77.7 | |||||||
| SPD hold | Majority | 3,326 | 2.3 | ||||||
2013 election
| Federal election (2013): Marburg[4] | |||||||||
|---|---|---|---|---|---|---|---|---|---|
| Notes: |
Blue background denotes the winner of the electorate vote.
| ||||||||
| Party | Candidate | Votes | % | ±% | Party votes | % | ±% | ||
| SPD | 55,982 | 43.7 | 42,749 | 33.4 | |||||
| CDU | Stefan Heck | 50,683 | 39.6 | 46,993 | 36.7 | ||||
| Green | Matthias Knoche | 7,595 | 5.9 | 13,443 | 10.5 | ||||
| Left | Janis Ehling | 6,746 | 5.3 | 8,720 | 6.8 | ||||
| AfD | 5,858 | 4.6 | |||||||
| Pirates | Michael Weber | 2,581 | 2.0 | 2,206 | 1.7 | ||||
| FDP | Jörg Hartmut Behlen | 2,229 | 1.7 | 5,111 | 4.0 | ||||
| NPD | Alfred Hermann Horst | 1,459 | 1.1 | 1,034 | 0.8 | ||||
| PARTEI | Marcus-Alexander Assmann | 727 | 0.6 | 645 | 0.5 | ||||
| FW | 593 | 0.5 | |||||||
| REP | 313 | 0.2 | |||||||
| PRO | 109 | 0.1 | |||||||
| PSG | 62 | 0.0 | |||||||
| BüSo | 47 | 0.0 | |||||||
| MLPD | 26 | 0.0 | |||||||
| Informal votes | 2,943 | 3,036 | |||||||
| Total Valid votes | 128,002 | 127,909 | |||||||
| Turnout | 130,945 | 70.9 | |||||||
| SPD hold | Majority | 5,299 | 4.1 | ||||||
2009 election
| Federal election (2009): Marburg[5] | |||||||||
|---|---|---|---|---|---|---|---|---|---|
| Notes: |
Blue background denotes the winner of the electorate vote.
| ||||||||
| Party | Candidate | Votes | % | ±% | Party votes | % | ±% | ||
| SPD | 51,712 | 38.9 | 38,139 | 28.7 | |||||
| CDU | Stefan Heck | 47,322 | 35.6 | 41,356 | 31.1 | ||||
| FDP | Jörg Behlen | 10,964 | 8.2 | 17,410 | 13.1 | ||||
| Left | Hans Köster-Sollwedel | 10,857 | 8.2 | 13,181 | 9.9 | ||||
| Green | Matthias Knoche | 10,366 | 7.8 | 16,884 | 12.7 | ||||
| Pirates | 2,625 | 2.0 | |||||||
| NPD | Manuel Mann | 1,690 | 1.3 | 1,290 | 1.0 | ||||
| Tierschutzpartei | 1,116 | 0.8 | |||||||
| REP | 843 | 0.6 | |||||||
| BüSo | 151 | 0.1 | |||||||
| DVU | 76 | 0.1 | |||||||
| MLPD | 27 | 0.0 | |||||||
| Informal votes | 2,382 | 2,195 | |||||||
| Total Valid votes | 132,911 | 133,098 | |||||||
| Turnout | 135,293 | 73.1 | |||||||
| SPD hold | Majority | 4,390 | 3.3 | ||||||
References
- "Constituency Marburg". Federal Returning Officer.
- "Results for Marburg". Federal Returning Officer.
- Results for Marburg
- Results for Marburg
- Results for Marburg
| Current | |
|---|---|
| Other states |
|
| See also | |