Wyre Forest (UK Parliament constituency)
Wyre Forest is a county constituency represented in the House of Commons of the Parliament of the United Kingdom. It elects one Member of Parliament (MP) by the first past the post system of election. The current MP is Mark Garnier of the Conservative Party who was re-elected in the 2019 general election.
| Wyre Forest | |
|---|---|
| County constituency for the House of Commons | |
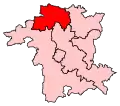 Boundary of Wyre Forest in Worcestershire | |
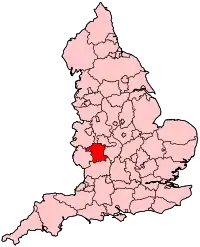 Location of Worcestershire within England | |
| County | Worcestershire |
| Electorate | 77,800 (December 2010)[1] |
| Major settlements | Bewdley Kidderminster Stourport-on-Severn |
| Current constituency | |
| Created | 1983 |
| Member of Parliament | Mark Garnier (Conservative) |
| Number of members | One |
| Created from | Kidderminster |
Members of Parliament
| Election | Member[2] | Party | |
|---|---|---|---|
| 1983 | Esmond Bulmer | Conservative | |
| 1987 | Anthony Coombs | Conservative | |
| 1997 | David Lock | Labour | |
| 2001 | Richard Taylor | Health Concern | |
| 2010 | Mark Garnier | Conservative | |
Boundaries
The Wyre Forest constituency as it was drawn for the 1997 election was almost coterminous with the Wyre Forest district, with around 2,000 electors from the district in the neighbouring Leominster constituency. Following its review of parliamentary constituencies for the 2010 election, the Boundary Commission recommended that the portions of the district currently in Leominster move into this seat, making the constituency and district wholly coterminous. These changes were brought about in part by the consideration of Worcestershire and Herefordshire separately for the drawing of parliamentary constituency boundaries.
2010–present: The District of Wyre Forest.
1997–2010: All the wards of the District of Wyre Forest except the Rock and Ribbesford ward.
1983–1997: The District of Wyre Forest.
History
The Wyre Forest constituency was first fought under its present name in the 1983 general election, having succeeded the old Kidderminster seat, and was won for the Conservatives by Esmond Bulmer. Wyre Forest was held with relative ease by the Conservatives' Anthony Coombs in the 1987 and 1992 general elections; however the 1997 Labour landslide saw that party gain the seat with David Lock securing a majority of almost 7,000. Anger over the downgrading of Kidderminster Hospital reflected on Lock at the 2001 election, and Health Concern's Richard Taylor stormed to a decisive victory, then held the seat with a considerably reduced majority in 2005. Taylor lost to the Conservatives in the 2010 general election.[3]
Turnout in the Wyre Forest at general elections has generally been around 2-3% above the national average, but in 2001 the constituency recorded a 68.0% turnout as against 59.4% nationally; this spike (not repeated in 2005) is widely attributed to the intense local feelings on the hospital issue.
Elections
Elections in the 2010s
| Party | Candidate | Votes | % | ±% | |
|---|---|---|---|---|---|
| Conservative | Mark Garnier | 32,960 | 65.2 | +6.8 | |
| Labour | Robin Lunn | 11,547 | 22.8 | –9.5 | |
| Liberal Democrats | Shazu Miah | 4,081 | 8.1 | +4.3 | |
| Green | John Davis | 1,973 | 3.9 | +1.9 | |
| Majority | 21,413 | 42.4 | +18.3 | ||
| Turnout | 50,561 | 64.8 | –1.0 | ||
| Conservative hold | Swing | +8.2 | |||
| Party | Candidate | Votes | % | ±% | |
|---|---|---|---|---|---|
| Conservative | Mark Garnier | 29,859 | 58.4 | ||
| Labour | Matt Lamb | 16,525 | 32.3 | ||
| Liberal Democrats | Shazu Miah | 1,943 | 3.8 | ||
| UKIP | George Connolly | 1,777 | 3.5 | ||
| Green | Brett Caulfield | 1,025 | 2.0 | ||
| Majority | 13,334 | 26.1 | |||
| Turnout | 51,223 | 65.8 | |||
| Conservative hold | Swing | ||||
| Party | Candidate | Votes | % | ±% | |
|---|---|---|---|---|---|
| Conservative | Mark Garnier | 22,394 | 45.3 | ||
| Labour | Matt Lamb | 9,523 | 19.3 | ||
| UKIP | Michael Wrench | 7,967 | 16.1 | ||
| National Health Action | Richard Taylor | 7,211 | 14.6 | ||
| Liberal Democrats | Andy Crick | 1,228 | 2.5 | ||
| Green | Natalie McVey | 1,117 | 2.3 | ||
| Majority | 12,871 | 26.0 | |||
| Turnout | 49,440 | 63.8 | |||
| Conservative hold | Swing | ||||
| Party | Candidate | Votes | % | ±% | |
|---|---|---|---|---|---|
| Conservative | Mark Garnier | 18,793 | 36.9 | ||
| Health Concern | Richard Taylor | 16,150 | 31.7 | ||
| Labour | Nigel Knowles | 7,298 | 14.3 | ||
| Liberal Democrats | Neville Farmer | 6,040 | 11.9 | ||
| UKIP | Michael Wrench | 1,498 | 2.9 | ||
| BNP | Gordon Howells | 1,120 | 2.2 | ||
| Majority | 2,643 | 5.2 | N/A | ||
| Turnout | 50,899 | 66.8 | |||
| Conservative gain from Health Concern | Swing | ||||
Elections in the 2000s
| Party | Candidate | Votes | % | ±% | |
|---|---|---|---|---|---|
| Health Concern | Richard Taylor | 18,739 | 39.9 | ||
| Conservative | Mark Garnier | 13,489 | 28.7 | ||
| Labour | Marc Bayliss | 10,716 | 22.8 | ||
| Liberal | Frances Oborski | 2,666 | 5.7 | ||
| UKIP | Rustie Lee | 1,074 | 2.3 | ||
| Monster Raving Loony | Bert Priest | 303 | 0.6 | ||
| Majority | 5,250 | 11.2 | |||
| Turnout | 46,987 | 64.2 | |||
| Health Concern hold | Swing | ||||
| Party | Candidate | Votes | % | ±% | |
|---|---|---|---|---|---|
| Health Concern | Richard Taylor | 28,487 | 58.1 | ||
| Labour | David Lock | 10,857 | 22.1 | ||
| Conservative | Mark Simpson | 9,350 | 19.1 | ||
| UKIP | Jim Millington | 368 | 0.8 | ||
| Majority | 17,630 | 36.0 | N/A | ||
| Turnout | 49,062 | 68.0 | |||
| Health Concern gain from Labour | Swing | ||||
Elections in the 1990s
| Party | Candidate | Votes | % | ±% | |
|---|---|---|---|---|---|
| Labour | David Lock | 26,843 | 48.8 | +18.0 | |
| Conservative | Anthony Coombs | 19,897 | 36.1 | -11.7 | |
| Liberal Democrats | David Cropp | 4,377 | 8.0 | -13.4 | |
| Referendum | William Till | 1,956 | 3.6 | N/A | |
| Liberal | Chris Harvey | 1,670 | 3.0 | N/A | |
| UKIP | Jim Millington | 312 | 0.6 | N/A | |
| Majority | 6,946 | 12.7 | N/A | ||
| Turnout | 55,055 | 75.4 | -8.9 | ||
| Labour gain from Conservative | Swing | ||||
| Party | Candidate | Votes | % | ±% | |
|---|---|---|---|---|---|
| Conservative | Anthony Coombs | 28,983 | 47.8 | ||
| Labour | Ross Maden | 18,642 | 30.8 | ||
| Liberal Democrats | Mark D. Jones | 12,958 | 21.4 | ||
| Majority | 10,341 | 17.0 | |||
| Turnout | 60,583 | 82.3 | |||
| Conservative hold | Swing | ||||
Elections in the 1980s
| Party | Candidate | Votes | % | ±% | |
|---|---|---|---|---|---|
| Conservative | Anthony Coombs | 25,877 | 47.1 | -1.3 | |
| Liberal | Anthony Batchelor | 18,653 | 33.98 | +1.6 | |
| Labour | Nigel Knowles | 10,365 | 18.88 | -0.3 | |
| Majority | 7,224 | 13.16 | -2.7 | ||
| Turnout | 77.55 | +2.4 | |||
| Conservative hold | Swing | ||||
| Party | Candidate | Votes | % | ±% | |
|---|---|---|---|---|---|
| Conservative | Esmond Bulmer | 24,809 | 48.37 | ||
| Liberal | AJ Batchelor | 16,632 | 32.43 | ||
| Labour | RB Williams | 9,850 | 19.20 | ||
| Majority | 8,177 | 15.94 | |||
| Turnout | 75.10 | ||||
| Conservative win (new seat) | |||||
Notes and references
- "Electorate Figures - Boundary Commission for England". 2011 Electorate Figures. Boundary Commission for England. 4 March 2011. Archived from the original on November 6, 2010. Retrieved 13 March 2011.
- Leigh Rayment's Historical List of MPs – Constituencies beginning with "W" (part 5)
- Tory hails 'fresh start' for Wyre Forest - Kidderminster Shuttle
- "Wyre Forest Parliamentary constituency". BBC News. BBC. Retrieved 30 November 2019.
- "Wyre Forest results". BBC News. Retrieved 9 June 2017.
- "Election Data 2015". Electoral Calculus. Archived from the original on 17 October 2015. Retrieved 17 October 2015.
- "Election Data 2010". Electoral Calculus. Archived from the original on 26 July 2013. Retrieved 17 October 2015.
- "Wyre Forest". BBC News Online. Retrieved 2010-05-07.
- "Result: Wyre Forest". BBC News. 6 May 2005.
- "Election Data 2005". Electoral Calculus. Archived from the original on 15 October 2011. Retrieved 18 October 2015.
- "Election Data 2001". Electoral Calculus. Archived from the original on 15 October 2011. Retrieved 18 October 2015.
- "Election Data 1997". Electoral Calculus. Archived from the original on 15 October 2011. Retrieved 18 October 2015.
- "Election Data 1992". Electoral Calculus. Archived from the original on 15 October 2011. Retrieved 18 October 2015.
- "Politics Resources". Election 1992. Politics Resources. 9 April 1992. Retrieved 2010-12-06.
- "Election Data 1987". Electoral Calculus. Archived from the original on 15 October 2011. Retrieved 18 October 2015.
- "Election Data 1983". Electoral Calculus. Archived from the original on 15 October 2011. Retrieved 18 October 2015.