Yosemite Valley, California
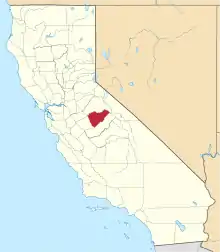
Yosemite Valley is a census-designated place (CDP) in Mariposa County, California, United States. It consists of the developed area of Yosemite Village and the other areas of the Yosemite Valley in Yosemite National Park. The population was 1,035 at the 2010 census, up from 265 at the 2000 census.
Yosemite Valley | |
|---|---|
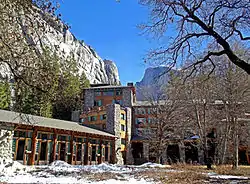
 The Ahwahnee Hotel. | |
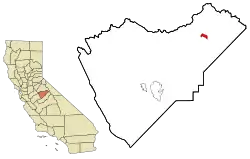
 Location in Mariposa County and the state of California | |
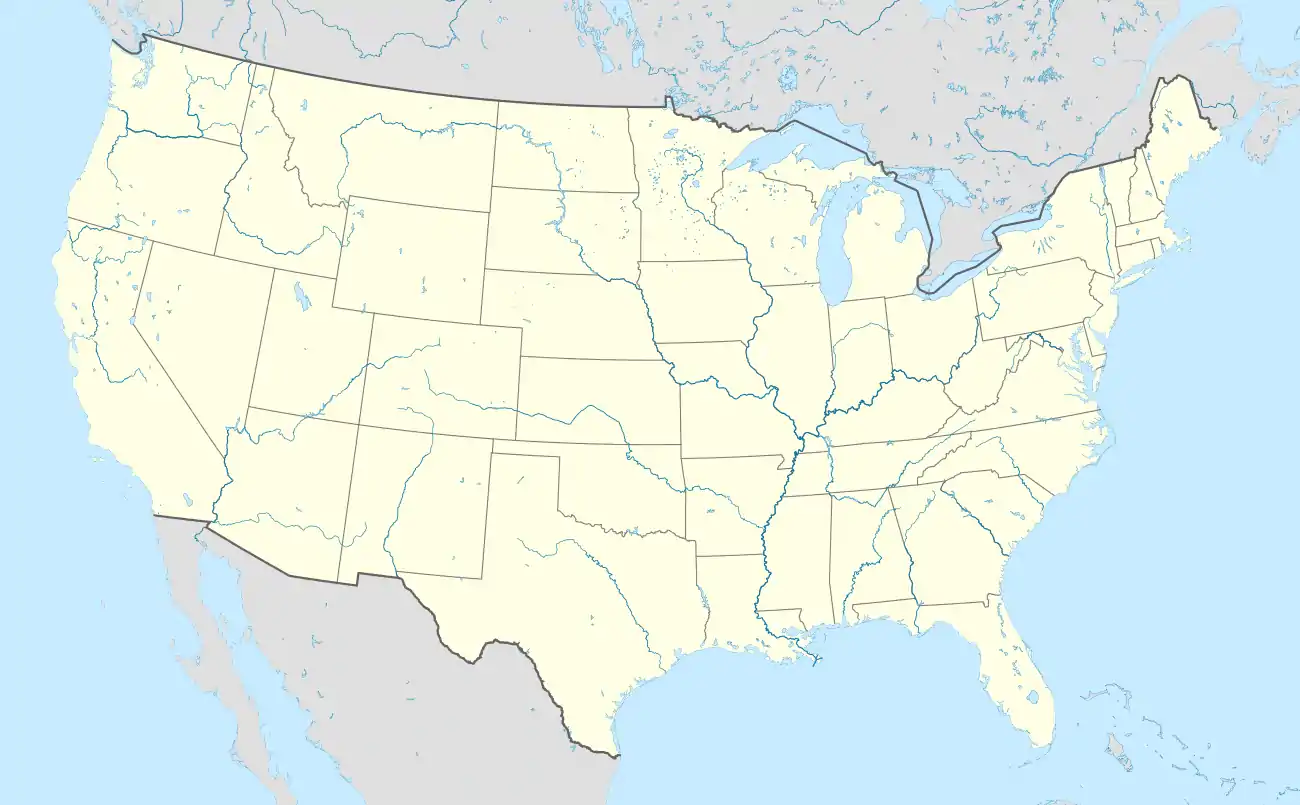
 Yosemite Valley Location in the United States | |
| Coordinates: 37°44′36″N 119°34′33″W | |
| Country | |
| State | |
| County | |
| Area | |
| • Total | 2.120 sq mi (5.492 km2) |
| • Land | 2.059 sq mi (5.334 km2) |
| • Water | 0.061 sq mi (0.159 km2) 2.89% |
| Population (2010) | |
| • Total | 1,035 |
| • Density | 490/sq mi (190/km2) |
| Time zone | UTC−08:00 (Pacific (PST)) |
| • Summer (DST) | UTC−07:00 (PDT) |
| ZIP Code | 95389 |
| Area code(s) | 209 |
| FIPS code | 06-86912 |
Situated along the north side of the valley floor, its permanent population includes staff of the National Park Service, which administers the park, and some concession workers associated with various contracts in the Park.
The Village has some public facilities, such as a fire station, a post office (ZIP Code 95389), a medical clinic, a convenience store, restaurants, gift shops, a school (kindergarten through eighth grade). The Park's headquarters facilities and its main visitor center are also located here.
The Yosemite Lodge is located on the west end of the village near Yosemite Falls. The Ahwahnee Hotel is a few blocks to the north. Both are operated by concessionaires under contract to the National Park Service. The architecture of Yosemite Village is characterized by shed style and makes extensive use of native woods. The earliest 20th-century buildings were designed by landscape architect Charles Punchard, Jr., among others in the National Park Service.
The first US post office opened in 1869, originally named "Yo Semite." The spelling was changed to Yosemite in 1908 and to Yosemite National Park in 1922.[2] In 1906, Major H.C. Benson was commanded to build and garrison Fort Yosemite in the valley.[2] US Army troops were stationed at Fort Yosemite until 1916, when the National Park Service was established to administer Yosemite and other national parks.[2]
Curry Village is one of the lodging options in the area.
Geography
Yosemite Valley is located at 37°44′36″N 119°34′33″W (37.743324, -119.575724).[3]
According to the United States Census Bureau, the community has a total area of 2.1 square miles (5.4 km2), 97.11% of it land and 2.89% of it water.
Climate
| Climate data for Yosemite Valley, California | |||||||||||||
|---|---|---|---|---|---|---|---|---|---|---|---|---|---|
| Month | Jan | Feb | Mar | Apr | May | Jun | Jul | Aug | Sep | Oct | Nov | Dec | Year |
| Record high °F (°C) | 72 (22) |
82 (28) |
90 (32) |
96 (36) |
99 (37) |
103 (39) |
115 (46) |
110 (43) |
108 (42) |
98 (37) |
86 (30) |
73 (23) |
115 (46) |
| Average high °F (°C) | 47.2 (8.4) |
53.1 (11.7) |
58.7 (14.8) |
65.9 (18.8) |
72.8 (22.7) |
81.4 (27.4) |
89.9 (32.2) |
89.5 (31.9) |
83.5 (28.6) |
72.5 (22.5) |
57.7 (14.3) |
47.5 (8.6) |
68.3 (20.2) |
| Daily mean °F (°C) | 36.5 (2.5) |
40.6 (4.8) |
44.8 (7.1) |
50.9 (10.5) |
57.2 (14.0) |
64.3 (17.9) |
71.5 (21.9) |
70.8 (21.6) |
65.2 (18.4) |
55.4 (13.0) |
44.0 (6.7) |
36.9 (2.7) |
53.2 (11.8) |
| Average low °F (°C) | 25.6 (−3.6) |
28.1 (−2.2) |
31.0 (−0.6) |
35.9 (2.2) |
41.6 (5.3) |
47.3 (8.5) |
53.2 (11.8) |
52.0 (11.1) |
46.7 (8.2) |
38.3 (3.5) |
30.2 (−1.0) |
26.2 (−3.2) |
38.0 (3.3) |
| Record low °F (°C) | −6 (−21) |
1 (−17) |
9 (−13) |
12 (−11) |
15 (−9) |
14 (−10) |
32 (0) |
32 (0) |
24 (−4) |
19 (−7) |
10 (−12) |
−1 (−18) |
−6 (−21) |
| Average precipitation inches (mm) | 6.51 (165) |
6.17 (157) |
5.39 (137) |
3.04 (77) |
1.47 (37) |
0.70 (18) |
0.31 (7.9) |
0.20 (5.1) |
0.66 (17) |
1.91 (49) |
3.93 (100) |
5.97 (152) |
36.26 (922) |
| Average snowfall inches (cm) | 16.2 (41) |
14.6 (37) |
12.9 (33) |
5.1 (13) |
0.2 (0.51) |
0.0 (0.0) |
0.0 (0.0) |
0.0 (0.0) |
0.0 (0.0) |
0.2 (0.51) |
3.6 (9.1) |
12.5 (32) |
65.3 (166.12) |
| Average precipitation days | 9 | 9 | 10 | 7 | 5 | 3 | 1 | 1 | 2 | 4 | 6 | 8 | 65 |
| Source: http://www.wrcc.dri.edu/cgi-bin/cliMAIN.pl?ca9855 | |||||||||||||
Demographics
2010
At the 2010 census Yosemite Valley had a population of 1,035. The population density was 488.1 people per square mile (188.4/km2). The racial makeup of Yosemite Valley was 831 (80.3%) White, 28 (2.7%) African American, 31 (3.0%) Native American, 31 (3.0%) Asian, 7 (0.7%) Pacific Islander, 70 (6.8%) from other races, and 37 (3.6%) from two or more races. Hispanic or Latino of any race were 123 people (11.9%).[4]
The census reported that 511 people (49.4% of the population) lived in households, 524 (50.6%) lived in non-institutionalized group quarters, and no one was institutionalized.
There were 282 households, 44 (15.6%) had children under the age of 18 living in them, 74 (26.2%) were opposite-sex married couples living together, 6 (2.1%) had a female householder with no husband present, 6 (2.1%) had a male householder with no wife present. There were 21 (7.4%) unmarried opposite-sex partnerships, and 3 (1.1%) same-sex married couples or partnerships. 127 households (45.0%) were one person and 12 (4.3%) had someone living alone who was 65 or older. The average household size was 1.81. There were 86 families (30.5% of households); the average family size was 2.84.
The age distribution was 81 people (7.8%) under the age of 18, 140 people (13.5%) aged 18 to 24, 413 people (39.9%) aged 25 to 44, 378 people (36.5%) aged 45 to 64, and 23 people (2.2%) who were 65 or older. The median age was 37.6 years. For every 100 females, there were 148.8 males. For every 100 females age 18 and over, there were 157.1 males.
There were 323 housing units at an average density of 152.3 per square mile, of the occupied units 2 (0.7%) were owner-occupied and 280 (99.3%) were rented. The homeowner vacancy rate was 0%; the rental vacancy rate was 1.8%. 3 people (0.3% of the population) lived in owner-occupied housing units and 508 people (49.1%) lived in rental housing units.
2000
At the 2000 census there were 265 people, 104 households, and 50 families residing in the community. The population density was 125.6 people per square mile (48.5/km2). There were 123 housing units at an average density of 58.3 per square mile (22.5/km2). The racial makeup of the community was 87.92% White, 0.75% African American, 2.26% Native American, 1.13% Asian, 4.91% from other races, and 3.02% from two or more races. Hispanic or Latino of any race were 15.09%.[5]
Of the 104 households, 27.9% had children under the age of 18 living with them, 43.3% were married couples living together, 2.9% had a female householder with no husband present, and 51.0% were non-families. 44.2% of households were one person, and 1.0% were one person aged 65 or older. The average household size was 2.02 and the average family size was 2.90.
In the community the population was spread out, with 20.0% under the age of 18, 7.2% from 18 to 24, 50.9% from 25 to 44, 20.0% from 45 to 64, and 1.9% 65 or older. The median age was 36 years. For every 100 females, there were 173.2 males. For every 100 females age 18 and over, there were 178.9 males.
The median household income was $58,393 and the median family income was $61,750. Males had a median income of $48,542 versus $24,524 for females. The per capita income for the community was $28,414. None of the population or families were below the poverty line.
Government
In the California State Legislature, Yosemite Valley is in the 8th Senate District, represented by Republican Andreas Borgeas, and the 5th Assembly District, represented by Republican Frank Bigelow.[6]
In the United States House of Representatives, Yosemite Valley is in California's 4th congressional district, represented by Republican Tom McClintock.[7]
References
- "2010 Census Gazetteer Files - Places - California". United States Census Bureau. Retrieved March 26, 2015.
- Durham, David L. (1998). California's Geographic Names: A Gazetteer of Historic and Modern Names of the State. Clovis, Calif.: Word Dancer Press. p. 849. ISBN 1-884995-14-4.
- "US Gazetteer files: 2010, 2000, and 1990". United States Census Bureau. 2011-02-12. Retrieved 2011-04-23.
- "2010 Census Interactive Population Search: CA - Yosemite Valley CDP". U.S. Census Bureau. Archived from the original on July 15, 2014. Retrieved July 12, 2014.
- "U.S. Census website". United States Census Bureau. Retrieved 2008-01-31.
- "Statewide Database". Regents of the University of California. Retrieved March 26, 2015.
- "California's 4th Congressional District - Representatives & District Map". Civic Impulse, LLC. Retrieved October 2, 2014.

