Zichow
Zichow is a municipality in the Uckermark district, in Brandenburg, Germany. It is part of the Amt ("collective municipality") Gramzow.
Zichow | |
|---|---|
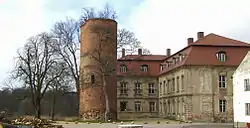 Zichow Castle with medieval keep | |
Location of Zichow within Uckermark district 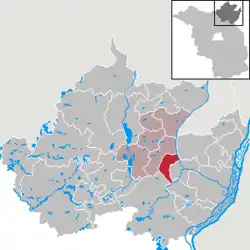 | |
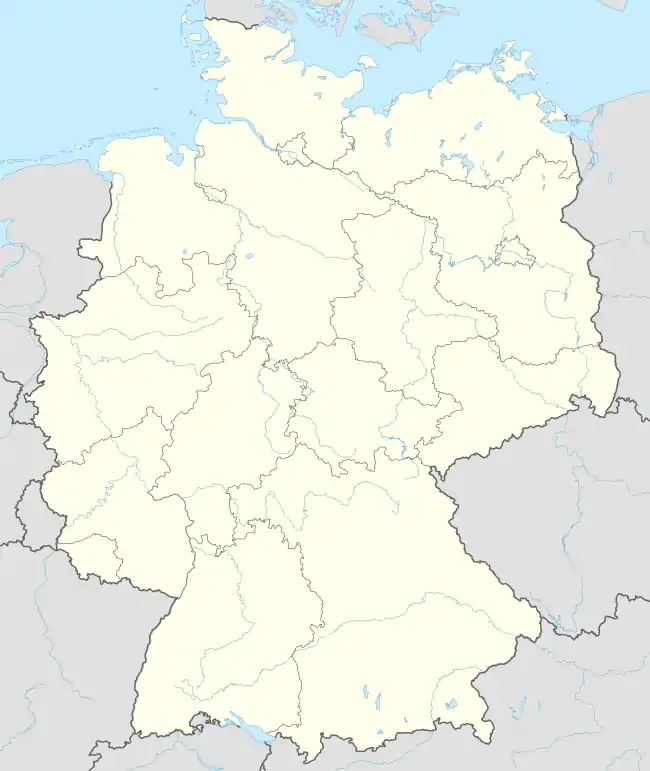 Zichow 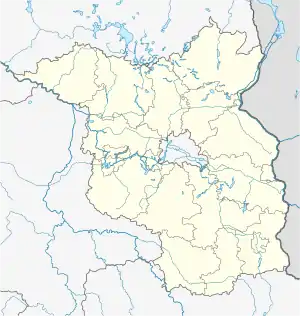 Zichow | |
| Coordinates: 53°11′00″N 14°02′00″E | |
| Country | Germany |
| State | Brandenburg |
| District | Uckermark |
| Municipal assoc. | Amt Gramzow |
| Government | |
| • Mayor | Martin Röthke |
| Area | |
| • Total | 32.15 km2 (12.41 sq mi) |
| Elevation | 65 m (213 ft) |
| Population (2019-12-31)[1] | |
| • Total | 547 |
| • Density | 17/km2 (44/sq mi) |
| Time zone | UTC+01:00 (CET) |
| • Summer (DST) | UTC+02:00 (CEST) |
| Postal codes | 16306 |
| Dialling codes | 039861 |
| Vehicle registration | UM |
| Website | www.amtgramzow.de |
Geography
Zichow is located within the historic Uckermark region. The municipal area comprises Zichow proper and the civil parishes (Ortsteile) of Fredersdorf and Golm, incorporated in 2001.
History
The former Slavic settlement of Zichow in the Margraviate of Brandenburg was first mentioned in a 1288 deed, issued by the Premonstratensian monks of nearby Gramzow Abbey. A fortress was erected at the site during the 13th century German Ostsiedlung migration. In 1354 Elector Louis II of Brandenburg ceded Zichow and Golm to the bordering Duchy of Pomerania.
Re-acquired by Elector Frederick II in 1447, the estates were enfeoffed to several Brandenburgian noble dynasties. All three parishes suffered from extended devastations during the Thirty Years' War. Zichow Castle was rebuilt in a Baroque style after a blaze in 1745.
Demography
|
|
|
Notable people
- Carl Strehlow (1871–1922), missionary and ethnologist
References
| Wikimedia Commons has media related to Zichow. |
- "Bevölkerung im Land Brandenburg nach amtsfreien Gemeinden, Ämtern und Gemeinden 31. Dezember 2019". Amt für Statistik Berlin-Brandenburg (in German). July 2020.
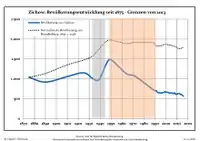
- Detailed data sources are to be found in the Wikimedia Commons.Population Projection Brandenburg at Wikimedia Commons
Towns and municipalities in Uckermark | ||
|---|---|---|
| Coat of Arms of Uckermark district | |
| Authority control |
|---|