1920 Republican Party presidential primaries
The 1920 Republican presidential primaries were the selection process by which voters of the Republican Party chose its nominee for President of the United States in the 1920 U.S. presidential election. The nominee was selected through a series of primary elections and caucuses culminating in the 1920 Republican National Convention held from June 8 to June 12, 1920, in Chicago, Illinois.[1]
| |||||||||||||||||||||||||||||||||||||||||||||||||||||
| |||||||||||||||||||||||||||||||||||||||||||||||||||||
 First place finishes by preference primary results | |||||||||||||||||||||||||||||||||||||||||||||||||||||
| |||||||||||||||||||||||||||||||||||||||||||||||||||||
Candidates
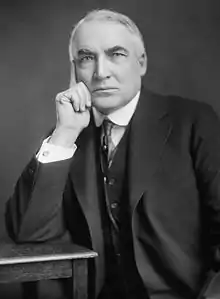
Nominee
Withdrew during convention
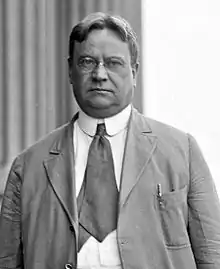

Former Army Chief of Staff
Leonard Wood
from New Hampshire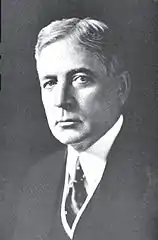
Businessman and former Director of the U.S. Food Administration
Herbert Hoover
from California
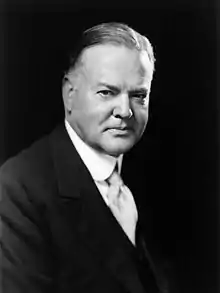
Withdrew during primaries

Edward R. Wood
from Pennsylvania
Results
| State | Date | Hiram Johnson | Leonard Wood | Frank O. Lowden | Herbert Hoover | Edward R. Wood | Warren G. Harding | John J. Pershing | Unpledged |
|---|---|---|---|---|---|---|---|---|---|
| New Hampshire | March 9 | 12.3% | 53.0% | 0.0% | 0.0% | 0.0% | 0.0% | 0.0% | 34.6% |
| North Dakota | March 16 | 96.1% | 3.1% | 0.2% | 0.0% | 0.0% | 0.0% | 0.0% | 0.0% |
| South Dakota | March 23 | 30.7% | 36.5% | 31.5% | 0.0% | 0.0% | 0.0% | 0.0% | 0.0% |
| Michigan | April 5 | 38.4% | 27.5% | 15.3% | 12.8% | 0.0% | 0.0% | 0.0% | 0.0% |
| New York | April 6 | 0.0% | 0.0% | 0.0% | 0.0% | 0.0% | 0.0% | 0.0% | 100.0% |
| Wisconsin | April 6 | 8.0% | 15.0% | 3.1% | 13.0% | 0.0% | 0.0% | 0.0% | 0.0% |
| Illinois | April 13 | 13.8% | 33.8% | 51.1% | 0.7% | 0.0% | 0.0% | 0.0% | 0.0% |
| Nebraska | April 20 | 46.2% | 31.0% | 0.0% | 0.0% | 0.0% | 0.0% | 20.3% | 0.0% |
| Montana | April 23 | 52.4% | 17.0% | 16.2% | 12.6% | 0.0% | 1.8% | 0.0% | 0.0% |
| Massachusetts | April 27 | 0.0% | 0.0% | 0.0% | 0.0% | 0.0% | 0.0% | 0.0% | 100.0% |
| New Jersey | April 27 | 49.0% | 50.2% | 0.0% | 0.9% | 0.0% | 0.0% | 0.0% | 0.0% |
| Ohio | April 27 | 6.5% | 41.9% | 0.0% | 4.0% | 0.0% | 47.6% | 0.0% | 0.0% |
| Maryland | May 3 | 33.6% | 66.4% | 0.0% | 0.0% | 0.0% | 0.0% | 0.0% | 0.0% |
| California | May 4 | 63.9% | 0.0% | 0.0% | 36.1% | 0.0% | 0.0% | 0.0% | 0.0% |
| Indiana | May 4 | 35.3% | 37.9% | 17.5% | 0.0% | 0.0% | 9.2% | 0.0% | 0.0% |
| Pennsylvania | May 18 | 3.8% | 1.4% | 0.0% | 1.0% | 92.3% | 0.0% | 0.0% | 0.0% |
| Vermont | May 18 | 7.7% | 66.1% | 0.5% | 10.8% | 0.0% | 0.0% | 0.0% | 0.0% |
| Oregon | May 21 | 38.4% | 36.5% | 13.0% | 12.1% | 0.0% | 0.0% | 0.0% | 0.0% |
| West Virginia | May 25 | 0.0% | 44.6% | 0.0% | 0.0% | 0.0% | 0.0% | 0.0% | 0.0% |
| North Carolina | June 5 | 73.3% | 26.7% | 0.0% | 0.0% | 0.0% | 0.0% | 0.0% | 0.0% |
| Legend: | 1st place (popular vote) |
2nd place (popular vote) |
3rd place (popular vote) |
|---|
References
- Kalb, Deborah (2016-02-19). Guide to U.S. Elections - Google Books. ISBN 9781483380353. Retrieved 2016-02-19.
This article is issued from Wikipedia. The text is licensed under Creative Commons - Attribution - Sharealike. Additional terms may apply for the media files.