1950 Greek legislative election
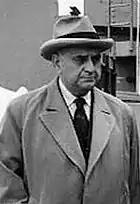
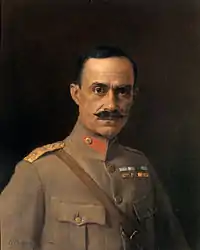
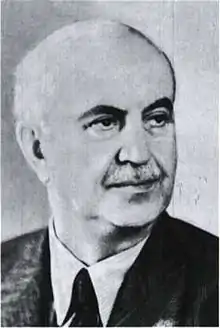
Parliamentary elections were held in Greece on 5 March 1950.[1] The People's Party emerged as the largest party in Parliament, winning 62 of the 250 seats.[2]
| |||||||||||||||||||||||||||||||||||||||||||||||||||||||||||||||||||||||||||||||||||||
All 250 seats of the Greek Parliament 126 seats were needed for a majority | |||||||||||||||||||||||||||||||||||||||||||||||||||||||||||||||||||||||||||||||||||||
|---|---|---|---|---|---|---|---|---|---|---|---|---|---|---|---|---|---|---|---|---|---|---|---|---|---|---|---|---|---|---|---|---|---|---|---|---|---|---|---|---|---|---|---|---|---|---|---|---|---|---|---|---|---|---|---|---|---|---|---|---|---|---|---|---|---|---|---|---|---|---|---|---|---|---|---|---|---|---|---|---|---|---|---|---|---|
| |||||||||||||||||||||||||||||||||||||||||||||||||||||||||||||||||||||||||||||||||||||
| |||||||||||||||||||||||||||||||||||||||||||||||||||||||||||||||||||||||||||||||||||||


| This article is part of a series on |
| Politics of Greece |
|---|
 |
|
|
Results
| Party | Votes | % | Seats |
|---|---|---|---|
| People's Party | 317,312 | 18.8 | 62 |
| Liberal Party | 291,083 | 17.2 | 56 |
| National Progressive Center Union | 277,739 | 16.4 | 45 |
| Georgios Papandreou Party | 180,185 | 10.7 | 35 |
| Democratic Alignment | 163,824 | 9.7 | 18 |
| Politically Independent Alignment | 137,618 | 8.1 | 16 |
| National Reconstruction Front | 88,979 | 5.3 | 7 |
| National Party of Greece | 61,575 | 3.6 | 7 |
| Party of Farmers and Labourers | 44,308 | 2.6 | 3 |
| New Party | 42,157 | 2.5 | 1 |
| National Party of Working People | 26,925 | 1.6 | 0 |
| Party for the National Union | 14,256 | 0.8 | 0 |
| Greek Working People's Party | 9,132 | 0.5 | 0 |
| National Resistance Party of Greece | 8,260 | 0.5 | 0 |
| Party Alliance of Greek Workers and Political Refresh Movement | 8,127 | 0.5 | 0 |
| List of Independents | 2,979 | 0.2 | 0 |
| Independent Liberal Party | 3,087 | 0.2 | 0 |
| Agricultural Party | 2,191 | 0.1 | 0 |
| Christian Labour Agricultural Party | 1,027 | 0.1 | 0 |
| Christian Political Union | 429 | 0.0 | 0 |
| Greek Drivers' Party | 157 | 0.0 | 0 |
| Independent Farmer Party | 146 | 0.0 | 0 |
| National Independent Party of War Wounded and Victims of Greece | 145 | 0.0 | 0 |
| Labour-Professional Party of Greece | 97 | 0.0 | 0 |
| Independent Agricultural Party of Greek People | 63 | 0.0 | 0 |
| Professional and Industrial Party of Greece | 42 | 0.0 | 0 |
| National Byzantine Party of Greece | 20 | 0.0 | 0 |
| Independents | 6,742 | 0.4 | 0 |
| Invalid/blank votes | 7,223 | – | – |
| Total | 1,695,768 | 100 | 250 |
| Source: Nohlen & Stöver | |||
References
- Dieter Nohlen & Philip Stöver (2010) Elections in Europe: A data handbook, p830 ISBN 978-3-8329-5609-7
- Nohlen & Stöver, p860
| Parliamentary elections |
|
|---|---|
| Head of state elections | |
| Local elections | |
| European elections | |
| Referendums | |
This article is issued from Wikipedia. The text is licensed under Creative Commons - Attribution - Sharealike. Additional terms may apply for the media files.