1971 New South Wales state election
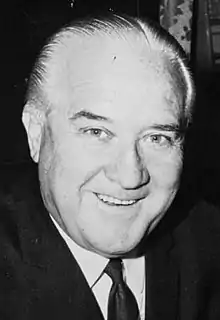
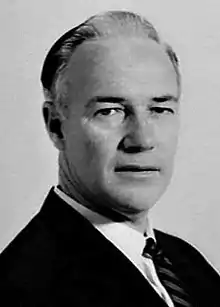
Elections for the New South Wales Legislative Assembly were held in the state of New South Wales, Australia, on Saturday 13 February 1971. The Liberal-Country Party coalition government led by Sir Robert Askin won a third term in office. The Labor Party opposition was led by Pat Hills.
| |||||||||||||||||||||||||||||||
All 96 seats in the New South Wales Legislative Assembly 49 Assembly seats were needed for a majority | |||||||||||||||||||||||||||||||
|---|---|---|---|---|---|---|---|---|---|---|---|---|---|---|---|---|---|---|---|---|---|---|---|---|---|---|---|---|---|---|---|
| |||||||||||||||||||||||||||||||
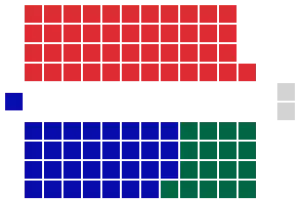
 Legislative Assembly after the election | |||||||||||||||||||||||||||||||
| |||||||||||||||||||||||||||||||
The Legislative Assembly had been enlarged by two members to 96 for the 1971 election. The seats of Sturt and Casino were established. Until 2019, this was the last time the Coalition won a third-term in New South Wales.
Key dates
| Date | Event |
|---|---|
| 13 January 1971 | The Legislative Assembly was dissolved, and writs were issued by the Governor to proceed with an election.[1] |
| 22 January 1971 | Nominations for candidates for the election closed at noon. |
| 13 February 1971 | Polling day, between the hours of 8am and 6pm. |
| 11 March 1971 | The fourth Askin-Cutler ministry was constituted. |
| 16 March 1971 | The writ was returned and the results formally declared. |
| 16 March 1971 | Parliament resumed for business. |
Results
|
New South Wales state election, 13 February 1971[1][2][3] | ||||||
|---|---|---|---|---|---|---|
| Enrolled voters | 2,457,021[lower-alpha 1] | |||||
| Votes cast | 2,291,484 | Turnout | 93.26 | -0.93 | ||
| Informal votes | 53,628 | Informal | 2.34 | -0.29 | ||
| Summary of votes by party | ||||||
| Party | Primary votes | % | Swing | Seats | Change | |
| Labor | 1,007,538 | 45.02 | +1.93 | 45 | + 6 | |
| Liberal | 799,801 | 35.74 | –2.73 | 32 | – 4 | |
| Country | 193,509 | 8.65 | –1.98 | 17 | ± 0 | |
| Democratic Labor | 71,050 | 3.17 | +0.89 | 0 | ± 0 | |
| Australia | 23,689 | 1.06 | +1.06 | 0 | ± 0 | |
| Def. of Govt Schools | 10,850 | 0.48 | +0.48 | 0 | ± 0 | |
| Communist | 2,098 | 0.09 | –0.18 | 0 | ± 0 | |
| Independent | 129,321 | 5.78 | +0.53 | 2 | ± 0 | |
| Total | 2,237,856 | 96 | ||||
Seats changing hands
| Seat | Pre-1971 | Swing | Post-1971 | ||||||
|---|---|---|---|---|---|---|---|---|---|
| Party | Member | Margin | Margin | Member | Party | ||||
| Burrendong | Country | Roger Wotton | 5.9 | -7.7 | 1.8 | Leo Nott | Labor | ||
| Campbelltown | Liberal | Max Dunbier | 2.4 | -2.5 | 0.1 | Cliff Mallam | Labor | ||
| Casino | Country | New Seat | 14.6 | -17.1 | 2.5 | Don Day | Labor | ||
| Gosford | Liberal | Ted Humphries | 1.4 | -4.0 | 2.6 | Keith O'Connell | Labor | ||
| Nepean | Liberal | Ron Dunbier | 5.2 | -6.8 | 1.6 | Ron Mulock | Labor | ||
| Wollongong | Liberal | Jack Hough | 0.5 | -0.6 | 0.1 | Eric Ramsay | Labor | ||
- In addition, Labor held the seat of Georges River, which it had won from the Liberals at the 1970 by-election.
Post-election pendulum
Notes
- There were 2,496,868 enrolled voters but 39,847 were enrolled in electorates (one Labor and one Country) which were uncontested at the election.[1]
References
- Green, Antony. "1971 election totals". New South Wales Election Results 1856-2007. Parliament of New South Wales. Retrieved 12 August 2019.
- Australian Government and Politics Database. "Parliament of New South Wales, Assembly election, 13 February 1971". Retrieved 6 February 2010.
- Hughes, Colin A. (1977). A handbook of Australian government and politics, 1965-1974. ANU Press. p. 107. ISBN 978-0-7081-1340-0.
This article is issued from Wikipedia. The text is licensed under Creative Commons - Attribution - Sharealike. Additional terms may apply for the media files.


