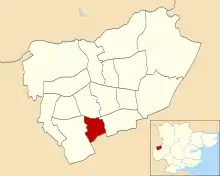
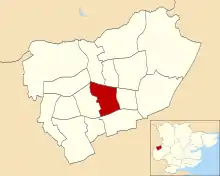
1976 Harlow District Council election
The 1976 Harlow District Council election took place on 6 May 1976 to elect members of Harlow District Council in Essex, England. This was on the same day as other local elections. The Labour Party retained control of the council.
| |||||||||||||||||||||||||||||
All 42 seats to Harlow District Council 22 seats needed for a majority | |||||||||||||||||||||||||||||
|---|---|---|---|---|---|---|---|---|---|---|---|---|---|---|---|---|---|---|---|---|---|---|---|---|---|---|---|---|---|
| |||||||||||||||||||||||||||||
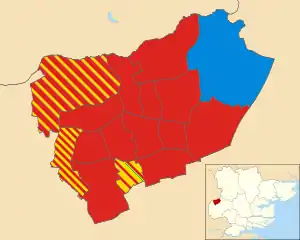 Map showing the results of contested wards in the 1976 Harlow District Council elections. | |||||||||||||||||||||||||||||
| |||||||||||||||||||||||||||||
Election result
| Party | Seats | Gains | Losses | Net gain/loss | Seats % | Votes % | Votes | +/− | |
|---|---|---|---|---|---|---|---|---|---|
| Labour | 35 | 81.3 | 49.5 | 10,959 | |||||
| Liberal | 4 | 12.5 | 31.2 | 6,915 | |||||
| Conservative | 3 | 6.3 | 14.9 | 3,310 | |||||
| Independent Labour | 0 | 0.0 | 3.1 | 696 | |||||
| Communist | 0 | 0.0 | 1.2 | 264 | |||||
Ward results
Brays Grove (3 seats)
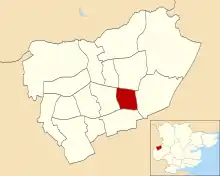
Location of Brays Grove ward
| Party | Candidate | Votes | % | |
|---|---|---|---|---|
| Labour | B. Evans | 699 | ||
| Labour | M. Danvers | 690 | ||
| Labour | D. Howard | 642 | ||
| Conservative | G. Groves | 353 | ||
| Conservative | J. Groves | 302 | ||
| Conservative | C. Johnson | 291 | ||
| Liberal | K. Sams | 187 | ||
| Liberal | P. Naylor | 172 | ||
| Liberal | J. Mallender | 164 | ||
| Turnout | 39.0% | |||
Great Parndon (2 seats)
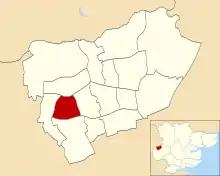
Location of Great Parndon ward
| Party | Candidate | Votes | % | |
|---|---|---|---|---|
| Labour | C. Cave | 645 | ||
| Labour | J. Cave | 609 | ||
| Liberal | G. Fallon | 518 | ||
| Conservative | P. Ellis | 458 | ||
| Conservative | B. Clenshaw | 453 | ||
| Liberal | A. Harwood | 420 | ||
| Turnout | 53.4% | |||
Hare Street and Town Centre (2 seats)
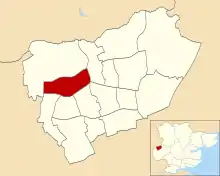
Location of Hare Street and Town Centre ward
| Party | Candidate | Votes | % | |
|---|---|---|---|---|
| Labour | J. Hobbs | 636 | ||
| Labour | J. Moore | 624 | ||
| Liberal | A. Merryweather | 449 | ||
| Liberal | C. Merryweather | 403 | ||
| Turnout | 38.2% | |||
Katherines With Sumner (2 seats)
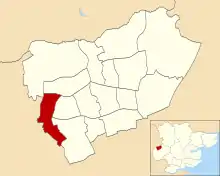
Location of Katherines with Sumner ward
| Party | Candidate | Votes | % | |
|---|---|---|---|---|
| Liberal | A. Trigwell | 205 | ||
| Labour | C. Cackett | 185 | ||
| Labour | H. Talbot | 179 | ||
| Liberal | R. Subryan | 177 | ||
| Turnout | 54.6% | |||
Kingsmoor (3 seats)
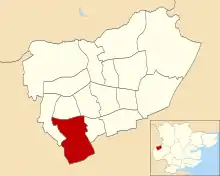
Location of Kingsmoor ward
| Party | Candidate | Votes | % | |
|---|---|---|---|---|
| Labour | T. Kent | 626 | ||
| Labour | A. Jones | 612 | ||
| Labour | R. Rowland | 543 | ||
| Liberal | M. Plon | 531 | ||
| Liberal | D. Benda | 483 | ||
| Liberal | E. Murray | 472 | ||
| Conservative | K. Cheshire | 424 | ||
| Conservative | E. Hughes | 419 | ||
| Conservative | D. Freyer | 410 | ||
| Independent Labour | A. Hudson | 182 | ||
| Turnout | 41.6% | |||
Latton Bush (3 seats)
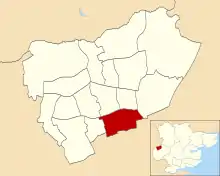
Location of Latton Bush ward
| Party | Candidate | Votes | % | |
|---|---|---|---|---|
| Labour | F. Jackson | 750 | ||
| Labour | P. Bruce | 716 | ||
| Labour | E. Albone | 658 | ||
| Independent Labour | E. Myers | 514 | ||
| Conservative | P. Barker | 436 | ||
| Liberal | J. Rudd | 412 | ||
| Liberal | R. Wilson | 375 | ||
| Liberal | J. Broughall | 355 | ||
| Turnout | 44.9% | |||
Little Parndon (3 seats)

Location of Little Parndon ward
| Party | Candidate | Votes | % | |
|---|---|---|---|---|
| Labour | D. Condon | 869 | ||
| Liberal | J. Jesse | 853 | ||
| Labour | M. Carter | 837 | ||
| Labour | G. Newport | 828 | ||
| Liberal | D. Eldridge | 798 | ||
| Liberal | A. Davies | 784 | ||
| Turnout | 43.7% | |||
Mark Hall North (2 seats)
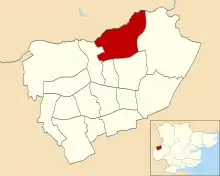
Location of Mark Hall North ward
| Party | Candidate | Votes | % | |
|---|---|---|---|---|
| Labour | J. McAlpine | 539 | ||
| Labour | S. Anderson | 522 | ||
| Conservative | M. Whyte | 341 | ||
| Conservative | C. Riley | 312 | ||
| Liberal | M. Ramsay | 217 | ||
| Liberal | L. Barton | 209 | ||
| Turnout | 47.6% | |||
Mark Hall South (3 seats)
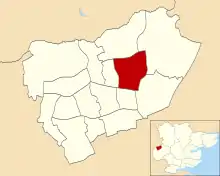
Location of Mark Hall South ward
| Party | Candidate | Votes | % | |
|---|---|---|---|---|
| Labour | D. Burnham | 1,002 | ||
| Labour | L. Smith | 917 | ||
| Labour | D. Richards | 916 | ||
| Conservative | E. Hagger | 396 | ||
| Conservative | A. Hayes | 393 | ||
| Conservative | C. Hand | 373 | ||
| Liberal | P. Simpson | 332 | ||
| Liberal | M. Brown | 312 | ||
| Liberal | V. Hook | 290 | ||
| Turnout | 43.4% | |||
Netteswell East (2 seats)
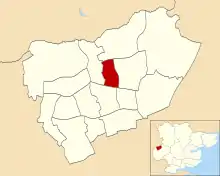
Location of Netteswell East ward
| Party | Candidate | Votes | % | |
|---|---|---|---|---|
| Labour | A. Graham | 686 | ||
| Labour | A. Garner | 660 | ||
| Liberal | D. Brown | 252 | ||
| Liberal | R. Day | 242 | ||
| Turnout | 33.9% | |||
Netteswell West (2 seats)
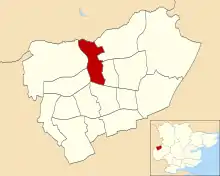
Location of Netteswell West ward
| Party | Candidate | Votes | % | |
|---|---|---|---|---|
| Labour | J. Desormeaux | 565 | ||
| Labour | R. Morris | 497 | ||
| Liberal | P. Davis | 219 | ||
| Liberal | A. Harwood | 213 | ||
| Turnout | 37.1% | |||
Old Harlow (3 seats)

Location of Old Harlow ward
| Party | Candidate | Votes | % | |
|---|---|---|---|---|
| Conservative | H. Dutton | 902 | ||
| Conservative | L. Dutton | 830 | ||
| Conservative | F. Smith | 798 | ||
| Labour | B. Jenkins | 716 | ||
| Labour | M. Gerrard | 704 | ||
| Labour | N. Dunkinson | 686 | ||
| Liberal | W. Breakall | 568 | ||
| Liberal | J. Kelly | 522 | ||
| Liberal | B. Zacks | 508 | ||
| Turnout | 55.1% | |||
Passmores (3 seats)

Location of Passmores ward
| Party | Candidate | Votes | % | |
|---|---|---|---|---|
| Labour | T. Farr | 828 | ||
| Labour | M. Juliff | 787 | ||
| Labour | M. Collyer | 751 | ||
| Liberal | D. Filler | 539 | ||
| Liberal | T. Owen | 496 | ||
| Communist | A. Booth | 264 | ||
| Turnout | 40.1% | |||
Potter Street (3 seats)
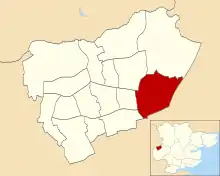
Location of Potter Street ward
| Party | Candidate | Votes | % | |
|---|---|---|---|---|
| Labour | B. Phelps | 736 | ||
| Labour | W. Gibson | 692 | ||
| Labour | R. Bruce | 600 | ||
| Liberal | P. Cooney | 389 | ||
| Liberal | S. Ward | 350 | ||
| Liberal | C. Dunham | 324 | ||
| Turnout | 39.6% | |||
References
- "Council compositions by year". The Elections Centre.
- "Local Election Summaries 1976". The Elections Centre.
- "Harlow District Council Election Results 1973-2012" (PDF). Elections Centre. Retrieved 27 September 2019.
This article is issued from Wikipedia. The text is licensed under Creative Commons - Attribution - Sharealike. Additional terms may apply for the media files.
