2019 Basildon Borough Council election
The 2019 Basildon Borough Council election took place on 2 May 2019 to elect members of Basildon Borough Council in Essex. This was on the same day as other local elections. The Conservative Party lost control of the council. which fell under no overall control.
| |||||||||||||||||||||||||||||||||||||||||||||||
14 of the 42 seats to Basildon Borough Council 22 seats needed for a majority | |||||||||||||||||||||||||||||||||||||||||||||||
|---|---|---|---|---|---|---|---|---|---|---|---|---|---|---|---|---|---|---|---|---|---|---|---|---|---|---|---|---|---|---|---|---|---|---|---|---|---|---|---|---|---|---|---|---|---|---|---|
| |||||||||||||||||||||||||||||||||||||||||||||||
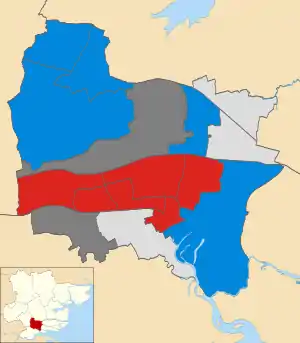 Map showing the results of contested wards in the 2019 Basildon Borough Council elections. | |||||||||||||||||||||||||||||||||||||||||||||||
| |||||||||||||||||||||||||||||||||||||||||||||||
After the election, the composition of the council was[1]
- Conservative 20
- Labour 15
- Independent 6
- UKIP 1
Result summary
| 2019 Basildon Borough Council election | ||||||||||
|---|---|---|---|---|---|---|---|---|---|---|
| Party | This election | Full council | This election | |||||||
| Seats | Net | Seats % | Other | Total | Total % | Votes | Votes % | +/− | ||
| Conservative | 5 | 35.7 | 15 | 20 | 47.6 | 13,356 | 43.1 | |||
| Labour | 6 | 42.9 | 9 | 15 | 35.7 | 7,567 | 24.4 | |||
| Independent | 1 | 7.1 | 3 | 4 | 9.5 | 3,313 | 10.7 | |||
| Wickford Independents | 2 | 14.3 | 0 | 2 | 4.8 | 3,261 | 10.5 | New | ||
| UKIP | 0 | 0.0 | 1 | 1 | 2.4 | 0 | 0.0 | |||
| Liberal Democrats | 0 | 0.0 | 0 | 0 | 0.0 | 2,900 | 9.4 | |||
| Green | 0 | 0.0 | 0 | 0 | 0.0 | 589 | 1.9 | |||
All comparisons in vote share are to the corresponding 2016 election.
Ward Results
An asterisk denotes an incumbent councillor seeking re-election.
Billericay East
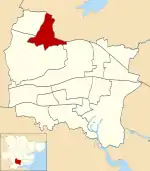
Location of Billericay East ward
| Party | Candidate | Votes | % | |
|---|---|---|---|---|
| Conservative | David John Dadds* | 1,881 | 64.1% | |
| Green | Sarah Anne Read | 589 | 20.1% | |
| Liberal Democrats | Karen Taurina Joy Manterfield | 236 | 8.0% | |
| Labour | Gillian Mary Palmer | 230 | 7.8% | |
| Majority | 1,292 | 44.0% | ||
| Turnout | 2,936 | 32% | ||
| Conservative hold | ||||
Billericay West
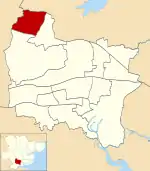
Location of Billericay West ward
| Party | Candidate | Votes | % | |
|---|---|---|---|---|
| Conservative | Daniel Lawrence* | 1,692 | 52.5% | |
| Liberal Democrats | Edward Krishan Sainsbury | 1,270 | 39.4% | |
| Labour | Tracey Jane Hilton | 260 | 8.1% | |
| Majority | 422 | 13.1% | ||
| Turnout | 3,222 | 35% | ||
| Conservative hold | ||||
Burstead
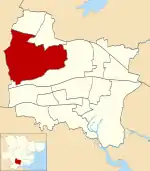
Location of Burstead ward
| Party | Candidate | Votes | % | |
|---|---|---|---|---|
| Conservative | Kevin Blake* | 2,278 | 82.9% | |
| Labour | Andrew Charles Buxton | 471 | 17.1% | |
| Majority | 1,807 | 65.7% | ||
| Turnout | 2,749 | 33% | ||
| Conservative hold | ||||
Fryerns
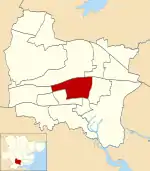
Location of Fryerns ward
| Party | Candidate | Votes | % | |
|---|---|---|---|---|
| Labour | Allan Robert Davies* | 1,021 | 55.3% | |
| Conservative | Perry John Ian Taylor | 552 | 29.9% | |
| Liberal Democrats | Vivien Jennifer Howard | 274 | 14.8% | |
| Majority | 469 | 25.4% | ||
| Turnout | 1,847 | 19% | ||
| Labour hold | ||||
Laindon Park
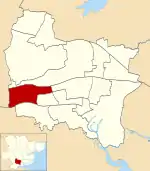
Location of Laindon Park ward
| Party | Candidate | Votes | % | |
|---|---|---|---|---|
| Labour | John Peter Richard Scarola | 810 | 35.5% | |
| Conservative | Christopher Jason Lee Allen | 754 | 33.1% | |
| Independent | Tony Low | 717 | 31% | |
| Majority | 56 | 2.5% | ||
| Turnout | 2,281 | 23% | ||
| Labour gain from Conservative | ||||
Lee Chapel North
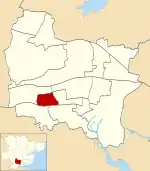
Location of Lee Chapel North ward
| Party | Candidate | Votes | % | |
|---|---|---|---|---|
| Labour | Kayode Adeniran | 870 | 52.6% | |
| Conservative | Yetunde Juliet Oyebola Adeshile | 437 | 26.4% | |
| Liberal Democrats | Michael Chandler | 348 | 21.0% | |
| Majority | 433 | 26.2% | ||
| Turnout | 1,655 | 17% | ||
| Labour hold | ||||
Nethermayne
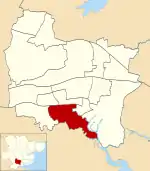
Location of Nethermayne ward
| Party | Candidate | Votes | % | |
|---|---|---|---|---|
| Independent | Pauline Patricia Kettle | 2,149 | 73.0% | |
| Labour | David John Goddard | 349 | 11.9% | |
| Conservative | Sandeep Singh Sandhu | 210 | 7.1% | |
| Independent | Stephen Michael Hodge* | 138 | 4.7% | |
| Liberal Democrats | Stephen William Nice | 96 | 3.3% | |
| Majority | 1,800 | 61.2% | ||
| Turnout | 2,942 | 30% | ||
| Independent gain from UKIP | ||||
Pitsea North West
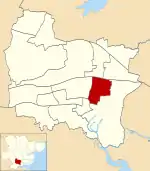
Location of Pitsea North West ward
| Party | Candidate | Votes | % | |
|---|---|---|---|---|
| Labour | Patricia Reid | 885 | 48.4% | |
| Conservative | Gary Canham | 696 | 38.1% | |
| Liberal Democrats | Martin Keith Howard | 246 | 13.5% | |
| Majority | 189 | 10.3% | ||
| Turnout | 1,827 | 20% | ||
| Labour gain from UKIP | ||||
Pitsea South East
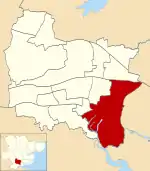
Location of Pitsea South East ward
| Party | Candidate | Votes | % | |
|---|---|---|---|---|
| Conservative | Craig Ronald Rimmer | 1,190 | 52.0% | |
| Labour | Alexander James Harrison | 900 | 39.3% | |
| Liberal Democrats | Clare Louise Nice | 199 | 8.7% | |
| Majority | 290 | 12.7% | ||
| Turnout | 2,289 | 26% | ||
| Conservative hold | ||||
St Martin's
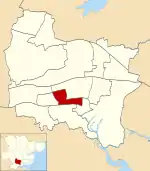
Location of St Martin's ward
| Party | Candidate | Votes | % | |
|---|---|---|---|---|
| Labour | Maryam Yaqub | 611 | 47.4% | |
| Conservative | Sandra Elizabeth Hillier | 448 | 34.7% | |
| Liberal Democrats | Philip Edward Jenkins | 231 | 17.9% | |
| Majority | 163 | 12.6% | ||
| Turnout | 1,290 | 21% | ||
| Labour hold | ||||
Vange
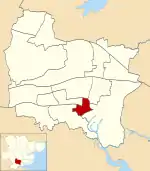
Location of Vange ward
| Party | Candidate | Votes | % | |
|---|---|---|---|---|
| Labour | Melissa Anne McGeorge* | 575 | 43.8% | |
| Conservative | Mark Richard Biddle | 428 | 32.6% | |
| Independent | Simon John Breedon | 309 | 23.6% | |
| Majority | 147 | 11.2% | ||
| Turnout | 1,312 | 19% | ||
| Labour hold | ||||
Wickford Castledon
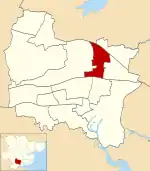
Location of Wickford Castleton ward
| Party | Candidate | Votes | % | |
|---|---|---|---|---|
| Conservative | Don Morris* | 1,060 | 54.0% | |
| Wickford Independents | Alan Ronald Ball | 665 | 33.9% | |
| Labour | Louise Rachel Catling | 238 | 12.1% | |
| Majority | 395 | 20.1% | ||
| Turnout | 1,963 | 31% | ||
| Conservative hold | ||||
Wickford North
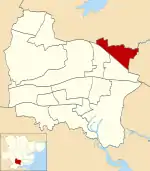
Location of Wickford North ward
| Party | Candidate | Votes | % | ||
|---|---|---|---|---|---|
| Wickford Independents | Eunice Christine Brockman | 1,247 | 44.9% | ||
| Conservative | Michael Owen Mowe* | 1,182 | 42.6% | ||
| Labour | Peter James Towler | 347 | 12.5% | ||
| Majority | 65 | 2.3% | |||
| Turnout | 2,776 | 27% | |||
| Wickford Independents gain from Conservative | |||||
Wickford Park
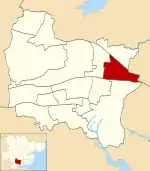
Location of Wickford Park ward
| Party | Candidate | Votes | % | ||
|---|---|---|---|---|---|
| Wickford Independents | David Harrison | 1,349 | 71.1% | ||
| Conservative | Stephanie Lucinda Hedley-Barnes | 548 | 28.9% | ||
| Majority | 801 | 42.2% | |||
| Turnout | 1,897 | 27% | |||
| Wickford Independents gain from Conservative | |||||
References
- "Basildon Borough Council". BBC News Online. 2 May 2019. Retrieved 3 May 2019.
- "Election results for Billericay East, 2 May 2019". Basildon Council. Retrieved 3 May 2019.
- "Basildon Council – Election results for Billericay West, 2 May 2019". Basildon Council. Retrieved 2 May 2019.
- "Basildon Council – Election results for Burstead, 2 May 2019". Basildon Council. Retrieved 2 May 2019.
- "Basildon Council – Election results for Fryerns, 2 May 2019". Basildon Council. Retrieved 2 May 2019.
- "Basildon Council – Election results for Laindon Park, 2 May 2019". Basildon Council. Retrieved 2 May 2019.
- "Basildon Council – Election results for Lee Chapel North, 2 May 2019". Basildon Council. Retrieved 2 May 2019.
- "Basildon Council – Election results for Nethermayne, 2 May 2019". Basildon Council. Retrieved 2 May 2019.
- "Basildon Council – Election results for Pitsea North West, 2 May 2019". Basildon Council. Retrieved 2 May 2019.
- "Basildon Council – Election results for Pitsea South East, 2 May 2019". Basildon Council. Retrieved 2 May 2019.
- "Basildon Council – Election results for St Martin's, 2 May 2019". Basildon Council. Retrieved 2 May 2019.
- "Basildon Council – Election results for Vange, 2 May 2019". Basildon Council. Retrieved 2 May 2019.
- "Basildon Council – Election results for Wickford Castledon, 2 May 2019". Basildon Council. Retrieved 2 May 2019.
- "Basildon Council – Election results for Wickford North, 2 May 2019". Basildon Council. Retrieved 2 May 2019.
- "Basildon Council – Election results for Wickford Park, 2 May 2019". Basildon Council. Retrieved 2 May 2019.
This article is issued from Wikipedia. The text is licensed under Creative Commons - Attribution - Sharealike. Additional terms may apply for the media files.