2019 Epping Forest District Council election
The 2019 Epping Forest District Council election will take place on 2 May 2019 to elect members of Epping Forest District Council in England. This was on the same day as other local elections.
| ||||||||||||||||||||||||||||||||||||||||||||||||||||||||||||||||||||||||||||||||||
18 seats to Epping Forest District Council 28 seats needed for a majority | ||||||||||||||||||||||||||||||||||||||||||||||||||||||||||||||||||||||||||||||||||
|---|---|---|---|---|---|---|---|---|---|---|---|---|---|---|---|---|---|---|---|---|---|---|---|---|---|---|---|---|---|---|---|---|---|---|---|---|---|---|---|---|---|---|---|---|---|---|---|---|---|---|---|---|---|---|---|---|---|---|---|---|---|---|---|---|---|---|---|---|---|---|---|---|---|---|---|---|---|---|---|---|---|---|
| ||||||||||||||||||||||||||||||||||||||||||||||||||||||||||||||||||||||||||||||||||
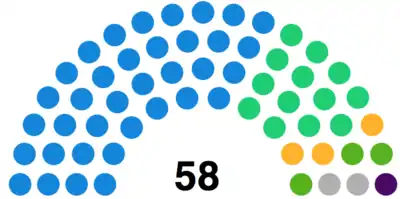 Council composition following the election | ||||||||||||||||||||||||||||||||||||||||||||||||||||||||||||||||||||||||||||||||||
| ||||||||||||||||||||||||||||||||||||||||||||||||||||||||||||||||||||||||||||||||||
Ward Results
Figures are compared to the last time these seats were contested in any election cycle for the Epping Forest District Council election, this is indicated.
Broadley Common, Epping Upland and Nazeing
| Party | Candidate | Votes | % | ±% | |
|---|---|---|---|---|---|
| Conservative | Nigel Avey | 313 | 71.6 | ||
| Green | Anna Widdup | 87 | 19.9 | ||
| Liberal Democrats | Edward Barnard | 37 | 8.4 | ||
| Majority | 226 | 51.7 | |||
| Turnout | 437 | 25.0 | |||
| Conservative hold | Swing | ||||
Buckhurst Hill West
| Party | Candidate | Votes | % | ±% | |
|---|---|---|---|---|---|
| Conservative | Aniket Patel | 977 | 47.7 | ||
| Liberal Democrats | Joseph Barkham | 891 | 43.5 | ||
| Labour | Jill Bostock | 126 | 6.1 | New | |
| Young People's | Thomas Hall | 51 | 2.4 | New | |
| Majority | 86 | 4.2 | |||
| Turnout | 2,045 | 38.0 | |||
| Conservative hold | Swing | ||||
Chipping Ongar, Greensted and Marden Ash
| Party | Candidate | Votes | % | ±% | |
|---|---|---|---|---|---|
| Conservative | Paul Keska | 573 | 59.5 | ||
| Liberal Democrats | Allan Edmunds | 224 | 23.2 | ||
| English Democrat | Robin Tilbrook | 166 | 17.2 | New | |
| Majority | 349 | 36.2 | |||
| Turnout | 963 | 28.0 | |||
| Conservative hold | Swing | ||||
Epping Hemnall
| Party | Candidate | Votes | % | ±% | |
|---|---|---|---|---|---|
| Liberal Democrats | Cherry McCredie | 1,066 | 62.7 | ||
| Conservative | Michael Ellis | 547 | 32.2 | ||
| Labour | Inez Collier | 85 | 5.0 | ||
| Majority | 519 | 30.5 | |||
| Turnout | 1,698 | 35.0 | |||
| Liberal Democrats gain from Conservative | Swing | ||||
Epping Lindsey and Thornwood Common
| Party | Candidate | Votes | % | ±% | |
|---|---|---|---|---|---|
| Conservative | Chris Whitbread | 862 | 46.0 | ||
| Liberal Democrats | Ingrid Black | 783 | 41.8 | ||
| Labour | Simon Bullough | 116 | 6.2 | ||
| Independent | Barry Johns | 109 | 5.8 | New | |
| Majority | 79 | 4.2 | |||
| Turnout | 1,870 | 35.0 | |||
| Conservative hold | Swing | ||||
Grange Hill
| Party | Candidate | Votes | % | ±% | |
|---|---|---|---|---|---|
| Conservative | Sheree Rackham | 699 | 64.0 | ||
| Labour | Kay Morrison | 392 | 36.0 | ||
| Majority | 307 | 28.1 | |||
| Turnout | 1,091 | 21.0 | |||
| Conservative hold | Swing | ||||
Hastingwood, Matching and Sheering
| Party | Candidate | Votes | % | ±% | |
|---|---|---|---|---|---|
| Independent | 'Richard Morgan' | Unopposed | |||
| Majority | New | New | |||
| Turnout | New | New | |||
| Independent hold | Swing | ||||
Lambourne
| Party | Candidate | Votes | % | ±% | |
|---|---|---|---|---|---|
| Conservative | Brian Rolfe | 316 | 74.7 | ||
| Liberal Democrats | Richard Griffiths | 107 | 25.3 | New | |
| Majority | 209 | 49.4 | |||
| Turnout | 423 | 27.0 | |||
| Conservative hold | Swing | ||||
Lower Nazeing
| Party | Candidate | Votes | % | ±% | |
|---|---|---|---|---|---|
| Conservative | Richard Bassett | 532 | 59.3 | ||
| UKIP | Martin Harvey | 208 | 23.2 | ||
| Liberal Democrats | Elaine Thatcher | 156 | 17.4 | ||
| Majority | 324 | 36.1 | |||
| Turnout | 896 | 27.0 | |||
| Conservative hold | Swing | ||||
Lower Sheering
| Party | Candidate | Votes | % | ±% | |
|---|---|---|---|---|---|
| Conservative | Paul Stalker | 264 | 68.2 | ||
| Liberal Democrats | Pesh Kapasiawala | 123 | 31.8 | New | |
| Majority | 141 | 36.4 | |||
| Turnout | 387 | 23.0 | |||
| Conservative hold | Swing | ||||
North Weald Bassett
| Party | Candidate | Votes | % | ±% | |
|---|---|---|---|---|---|
| Conservative | Jaymey McIvor | 470 | 53.5 | ||
| Independent | Andy Tyler | 225 | 25.6 | New | |
| Liberal Democrats | Georgia Simmons | 183 | 20.8 | ||
| Majority | 245 | 27.9 | |||
| Turnout | 878 | 24.0 | |||
| Conservative hold | Swing | ||||
Roydon
| Party | Candidate | Votes | % | ±% | |
|---|---|---|---|---|---|
| Conservative | Mary Sartin | 341 | 71.3 | ||
| Labour | Stuart Shipton | 76 | 15.8 | ||
| Liberal Democrats | Clive Amos | 61 | 12.7 | New | |
| Majority | 265 | 55.4 | |||
| Turnout | 478 | 28.0 | |||
| Conservative hold | Swing | ||||
Shelley
| Party | Candidate | Votes | % | ±% | |
|---|---|---|---|---|---|
| Conservative | 'Nigel Bedford' | Unopposed | |||
| Majority | New | New | |||
| Turnout | New | New | |||
| Conservative hold | Swing | ||||
Waltham Abbey High Beach
| Party | Candidate | Votes | % | ±% | |
|---|---|---|---|---|---|
| Conservative | Syd Stavrou | 295 | 59.9 | ||
| Liberal Democrats | Naomi Davies | 101 | 20.5 | New | |
| Independent | Paul Morris | 96 | 19.5 | ||
| Majority | 194 | 39.4 | |||
| Turnout | 492 | 25.0 | |||
| Conservative hold | Swing | ||||
Waltham Abbey North East
| Party | Candidate | Votes | % | ±% | |
|---|---|---|---|---|---|
| Conservative | Lillian Mitchell | 457 | 60.5 | ||
| Green | Rebecca Fricker | 182 | 24.1 | ||
| Liberal Democrats | Timothy Vaughan | 116 | 15.3 | ||
| Majority | 275 | 36.4 | |||
| Turnout | 755 | 24.0 | |||
| Conservative hold | Swing | ||||
Waltham Abbey Paternoster
| Party | Candidate | Votes | % | ±% | |
|---|---|---|---|---|---|
| For Britain | Julian Leppert | 321 | 40.7 | New | |
| Conservative | Liz Webster | 227 | 28.8 | ||
| Labour | Gareth Rawlings | 140 | 17.7 | ||
| Green | Vernon Gurtner | 69 | 8.7 | ||
| Liberal Democrats | Nick Read | 31 | 3.9 | New | |
| Majority | 94 | 11.9 | |||
| Turnout | 788 | 23.0 | |||
| For Britain gain from Conservative | Swing | ||||
Waltham Abbey Honey Lane
| Party | Candidate | Votes | % | ±% | |
|---|---|---|---|---|---|
| Conservative | Sam Kane | 437 | 40.2 | ||
| For Britain | Patricia Richardson | 250 | 23.0 | New | |
| Labour | Robert Greyson | 175 | 16.1 | ||
| Green | Carina Hall | 145 | 13.3 | ||
| Liberal Democrats | Philip Chadburn | 79 | 7.2 | ||
| Majority | 187 | 17.2 | |||
| Turnout | 1,086 | 23.0 | |||
| Conservative hold | Swing | ||||
Waltham Abbey South West
| Party | Candidate | Votes | % | ±% | |
|---|---|---|---|---|---|
| Green | Dave Plummer | 493 | 62.0 | ||
| Conservative | Ricki Gadsby | 302 | 38.0 | ||
| Majority | 191 | 24.0 | |||
| Turnout | 795 | 24.0 | |||
| Green gain from Conservative | Swing | ||||
References
This article is issued from Wikipedia. The text is licensed under Creative Commons - Attribution - Sharealike. Additional terms may apply for the media files.