2011 French cantonal elections
Cantonal elections to elect half the membership of the general councils of France's 100 departments were held on 20 and 27 March 2011.
| This article is part of a series on the |
| Politics of France |
|---|
 |
Electoral system
The cantonal elections use a two-round system similar to that employed in the country's legislative elections.
- Councillors are elected from single-member constituencies (cantons).
- A candidate securing the votes of at least 25% of the canton's registered voters and more than 50% of the total number of votes actually cast in the first round of voting is thereby elected. If no candidate satisfies these conditions, then a second round of voting is held one week later.
- Entitled to present themselves in the second round are the two candidates who received the highest number of votes in the first round, plus any other candidate or candidates who received the votes of at least 12.5% of those registered to vote in the canton. This threshold used to be set at 10% and was modified for this election.
- In the second round, the candidate receiving the highest number of votes is elected.
Context
French cantonal elections are usually paired with another election; for example, they were paired with the regional elections in 1998, the municipal elections in 2001, the regional elections in 2004, and the municipal elections in 2008. The 2011 elections were the first cantonal elections since 1992 not to be paired with another election.
Since cantonal councillors are electors for the senatorial elections, and considering that the forces in the Senate are, as of March 2011 almost balanced, the results of this election could play a role in the September 2011 senatorial elections.
Opinion polls
The poll below was conducted only in cantons subject to renewal.
| Polling firm | Fieldwork date | Sample size |
Abs. | EXG | FG | PS/ PRG |
DVG | EELV/ ECO |
MoDem | UMP/ NC |
DVD | FN | DIV |
|---|---|---|---|---|---|---|---|---|---|---|---|---|---|
| 2011 election | 20 Mar 2011 | – | 55.68% | 0.58% | 8.92% | 26.43% | 5.41% | 8.59% | 1.22% | 22.43% | 9.32% | 15.06% | 2.03% |
| Harris Interactive | 12–13 Mar 2011 | 1,240 | – | 1% | 10% | 32% | 9% | 2% | 28% | 15% | 3% | ||
Results

| Party | First round | Second round | Total seats | |||||
|---|---|---|---|---|---|---|---|---|
| Votes | % | Seats | Votes | % | Seats | |||
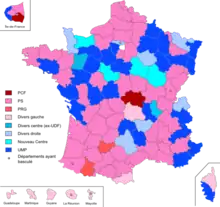
| Socialist Party (Parti socialiste) | 2,284,967 | 24.94 | 150 | 2,802,094 | 35.43 | 670 | 820 | |
| Europe Écologie – Les Verts | 752,992 | 8.22 | 0 | 216,144 | 2.73 | 27 | 27 | |
| Communist Party (Parti communiste français) | 724,911 | 7.91 | 19 | 381,096 | 4.82 | 97 | 116 | |
| Miscellaneous Left (Divers gauche) | 495,822 | 5.41 | 57 | 437,823 | 5.54 | 137 | 194 | |
| Left Radical Party (Parti radical de gauche) | 135,958 | 1.48 | 17 | 119,967 | 1.51 | 34 | 51 | |
| Left Party (Parti de gauche) | 92,386 | 1.01 | 1 | 16,095 | 0.20 | 4 | 5 | |
| Total Parliamentary Left | 4,487,036 | 48.97 | 244 | 3,972,949 | 50.23 | 968 | 1,212 | |
| Union for a Popular Movement (Union pour un mouvement populaire) | 1,554,744 | 16.97 | 92 | 1,581,756 | 20.00 | 277 | 369 | |
| Miscellaneous Right (Divers droite) | 853,892 | 9.32 | 77 | 744,170 | 9.41 | 187 | 264 | |
| Presidential Majority-New Centre (Majorité-Nouveau Centre) | 293,543 | 3.20 | 16 | 289,328 | 3.66 | 42 | 58 | |
| Presidential Majority (Majorité) | 206,488 | 2.25 | 21 | 197,085 | 2.49 | 41 | 62 | |
| Total "Presidential Majority" | 2,908,667 | 31.74 | 206 | 2,812,339 | 35.56 | 547 | 753 | |
| National Front (Front national) | 1,379,902 | 15.06 | 0 | 915,504 | 11.57 | 2 | 2 | |
| Others (Autres) | 123,543 | 1.35 | 6 | 95,251 | 1.20 | 28 | 34 | |
| Democratic Movement (Mouvement démocrate) | 111,887 | 1.22 | 2 | 74,224 | 0.94 | 14 | 16 | |
| Other Far-left (Extrême gauche) | 53,316 | 0.58 | 0 | 273 | 0.00 | 0 | 0 | |
| Regionalists and separatists | 48,468 | 0.53 | 2 | 18,280 | 0.23 | 3 | 5 | |
| Other ecologists | 34,112 | 0.37 | 0 | 16,074 | 0.20 | 2 | 2 | |
| Other far-right (Extrême droite) | 13,673 | 0.15 | 0 | 4,932 | 0.06 | 1 | 1 | |
| Totals | 9,160,604 | 100.00 | 460 | 7,909,826 | 100.00 | 1,566 | 2,026 | |
| Turnout | 9,439,097 | 44.32 | 8 513 399 | 44.77 | ||||
Abstention: 55.68%; invalid ballots; 2.95%