2014 European Parliament election in France
The 2014 European Parliament election in France for the election of the 8th delegation from France to the European Parliament took place on 24 May 2014 in the overseas territories of France, and on 25 May 2014 in metropolitan France. The number of seats allocated to France increased to 74, compared to 72 in the 2009 election, as a result of the 2013 reapportionment of seats in the European Parliament.
| |||||||||||||||||||||||||||||||||||||||||||||||||||||||||||||||||||||||||||||||||||||||||||||
All 74 French seats to the European Parliament | |||||||||||||||||||||||||||||||||||||||||||||||||||||||||||||||||||||||||||||||||||||||||||||
|---|---|---|---|---|---|---|---|---|---|---|---|---|---|---|---|---|---|---|---|---|---|---|---|---|---|---|---|---|---|---|---|---|---|---|---|---|---|---|---|---|---|---|---|---|---|---|---|---|---|---|---|---|---|---|---|---|---|---|---|---|---|---|---|---|---|---|---|---|---|---|---|---|---|---|---|---|---|---|---|---|---|---|---|---|---|---|---|---|---|---|---|---|---|
| Turnout | 42.43%[1] | ||||||||||||||||||||||||||||||||||||||||||||||||||||||||||||||||||||||||||||||||||||||||||||
| |||||||||||||||||||||||||||||||||||||||||||||||||||||||||||||||||||||||||||||||||||||||||||||
 | |||||||||||||||||||||||||||||||||||||||||||||||||||||||||||||||||||||||||||||||||||||||||||||
.jpg.webp)
.jpg.webp)


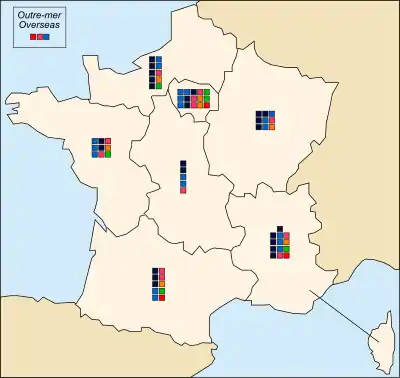
Previous (2009—2014) MEPs by European Political Group
| Key to the Political Groups in the European Parliament (France) | |||||
|---|---|---|---|---|---|
| National party | Seats/74 | EP group | Seats/754 | ||
| Union for a Popular Movement | 24 | European People's Party | 270 | ||
| Union of Democrats and Independents | 6 | ||||
| Europe Ecology – The Greens | 15 | The Greens–European Free Alliance | 59 | ||
| Party of the Corsican Nation | 1 | ||||
| Socialist Party | 13 | Socialists & Democrats | 189 | ||
| Democratic Movement | 5 | Alliance of Liberals and Democrats for Europe | 85 | ||
| CAP 21 | 1 | ||||
| Left Front | 5 | European United Left–Nordic Green Left | 34 | ||
| National Front | 3 | Non-Inscrits | |||
| Movement for France | 1 | Europe of Freedom and Democracy | 35 | ||
Opinion polling
.png.webp)
Results by parties
| ← 2009 • 2014 • 2019 → | ||||||||||
| National party | European party | European group | Votes | % | +/– | Seats | +/– | |||
|---|---|---|---|---|---|---|---|---|---|---|
| National Front (FN) | EAF | Non-Inscrits* | 4,712,461 | 24.86 | 18.52 |
24 / 74 |
21 | |||
| Union for a Popular Movement (UMP) | EPP | EPP | 3,943,819 | 20.80 | 7.07 |
20 / 74 |
9 | |||
| Socialist Party (PS) + Radical Party of the Left (PRG) Socialist Party (PS) Radical Party of the Left (PRG) |
PES | S&D | 2,650,357 | 13.98 | 2.5 |
13 / 74 12 / 74 1 / 74 |
1 1 | |||
| Democratic Movement (MoDem) + Union of Democrats and Independents (UDI) Radical Party (PR) Centrist Alliance (AC) New Centre (NC) Democratic Movement (MoDem) |
EDP | ALDE | 1,884,565 | 9.94 | [2]1.48 |
7 / 74 1 / 74 1 / 74 1 / 74 4 / 74 |
1 1 2 2 | |||
| Europe Écologie (EE) | EGP | Greens–EFA | 1,696,442 | 8.95 | 7.33 |
6 / 74 |
8 | |||
Left Front (FG)
Alliance of the Overseas (AO-M) |
PEL | GUE/NGL | 1,252,730 | 6.61 | 0.13 |
4 / 74 1 / 74 1 / 74 1 / 74 1 / 74 |
1 0 0 0 | |||
| Arise the Republic (DLR) | EUD | * | 744,441 | 3.82 | 2.05 |
0 / 74 |
0 | |||
| New Deal (ND) | None | * | 549,734 | 2.90 | new | 0 / 74 |
0 | |||
| We Citizens (NC) | None | * | 266,343 | 1.41 | new | 0 / 74 |
0 | |||
| Workers' Struggle (LO) | None | * | 222,491 | 1.17 | 0.03 |
0 / 74 |
0 | |||
| Independent Ecological Alliance (AEI) | None | * | 211,759 | 1.12 | 2.51 |
0 / 74 |
0 | |||
| Others | 840,619 | 4.40 | — | 0 / 74 |
0 | |||||
| Valid votes | 18,955,636 | 95.96 | ||||||||
| Blank and invalid votes | 797,504 | 4.04 | ||||||||
| Totals | 19,753,140 | 100.00 | — | 74 / 74 |
2 | |||||
| Electorate (eligible voters) and voter turnout | 46,555,253 | 42.43 | 1.71 |
|||||||
| Source: France-politique.fr and Ministry of the Interior | ||||||||||
Results by electoral divisions
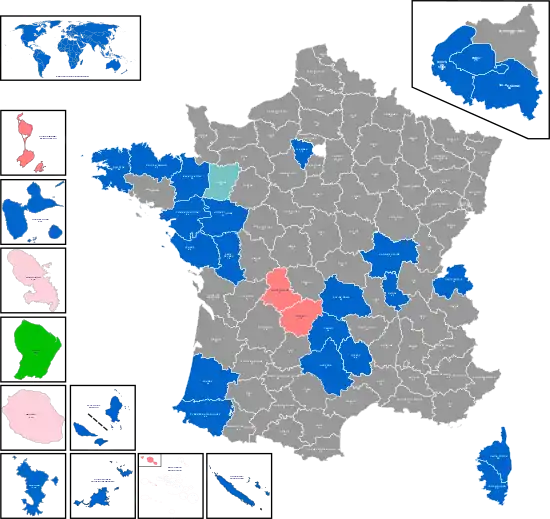
Results by departement
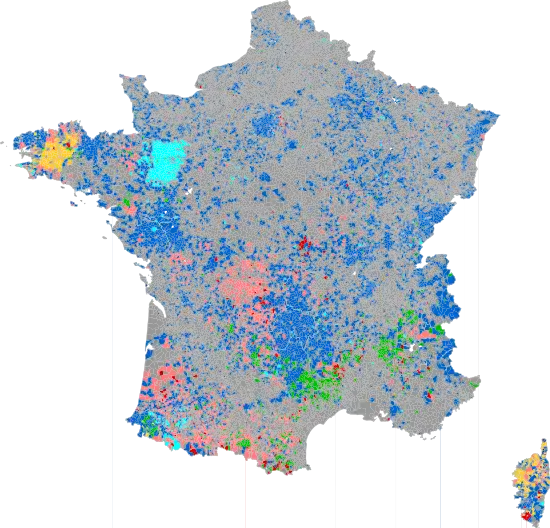
Results by communes (Metropolitan France)
References
- "Results of the 2014 European elections - Results by country - France - European Parliament". Results of the 2014 European elections - Results by country - France - European Parliament.
- only Democratic Movement (8.46)
| Presidential | |
|---|---|
| Parliamentary |
|
| Regional | |
| Departemental |
|
| Municipal | |
| Consular |
|
| European | |
| Referendums | |
| |
This article is issued from Wikipedia. The text is licensed under Creative Commons - Attribution - Sharealike. Additional terms may apply for the media files.