Abundance of elements in Earth's crust
The abundance of elements in Earth's crust is shown in tabulated form with the estimated crustal abundance for each chemical element shown as mg/kg, or parts per million (ppm) by mass (10,000 ppm = 1%).
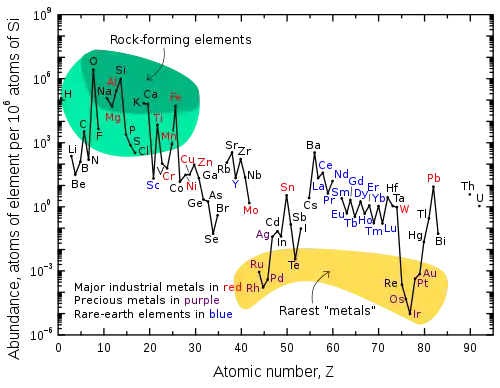
Abundance (atom fraction) of the chemical elements in Earth's upper continental crust as a function of atomic number. The rarest elements in the crust (shown in yellow) are not the heaviest, but are rather the siderophile (iron-loving) elements in the Goldschmidt classification of elements. These have been depleted by being relocated deeper into the Earth's core. Their abundance in meteoroids is higher. Tellurium and selenium are concentrated as sulfides in the core and have also been depleted by preaccretional sorting in the nebula that caused them to form volatile hydrogen selenide and hydrogen telluride.[1]
Estimates of elemental abundance are difficult because (a) the composition of the upper and lower crust are quite different, and (b) the composition of the continental crust can vary drastically by locality.[2]
| Rank | Z | Element | Symbol | Abundance in crust (ppm) by source | Annual production | ||||
|---|---|---|---|---|---|---|---|---|---|
| Darling[3] | Barbalace[4] | WebElements[5] | Israel Science and Technology[6] |
CRC[7] | (2016, tonnes)[8] | ||||
| 1 | 8 | oxygen | O | 466,000 | 474,000 | 460,000 | 467,100 | 461,000 (46.1%) | |
| 2 | 14 | silicon | Si | 277,200 | 277,100 | 270,000 | 276,900 | 282,000 (28.2%) | 7,200,000 |
| 3 | 13 | aluminium | Al | 81,300 | 82,000 | 82,000 | 80,700 | 82,300 (8.23%) | 57,600,000 |
| 4 | 26 | iron | Fe | 50,000 | 41,000 | 63,000 | 50,500 | 56,300 (5.63%) | 1,150,000,000 |
| 5 | 20 | calcium | Ca | 36,300 | 41,000 | 50,000 | 36,500 | 41,500 (4.15%) | |
| 6 | 11 | sodium | Na | 28,300 | 23,000 | 23,000 | 27,500 | 23,600 (2.36%) | 255,000,000 |
| 7 | 12 | magnesium | Mg | 20,900 | 23,000 | 29,000 | 20,800 | 23,300 (2.33%) | 27,700,000 |
| 8 | 19 | potassium | K | 25,900 | 21,000 | 15,000 | 25,800 | 20,900 (2.09%) | |
| 9 | 22 | titanium | Ti | 4,400 | 5,600 | 6,600 | 6,200 | 5,650 (0.565%) | 6,600,000 |
| 10 | 1 | hydrogen | H | 1,400 | 1,500 | 1,400 | 1,400 (0.14%) | ||
| 11 | 15 | phosphorus | P | 1,200 | 1,000 | 1,000 | 1,300 | 1,050 (0.105%) | |
| 12 | 25 | manganese | Mn | 1,000 | 950 | 1,100 | 900 | 950 (0.095%) | 16,000,000 |
| 13 | 9 | fluorine | F | 800 | 950 | 540 | 290 | 585 (0.0585%) | |
| 14 | 56 | barium | Ba | 500 | 340 | 340 | 500 | 425 (0.0425%) | |
| 15 | 38 | strontium | Sr | 370 | 360 | 370 (0.037%) | 350,000 | ||
| 16 | 16 | sulfur | S | 500 | 260 | 420 | 520 | 350 (0.035%) | 69,300,000 |
| 17 | 6 | carbon | C | 300 | 480 | 1,800 | 940 | 200 (0.02%) | |
| 18 | 40 | zirconium | Zr | 190 | 130 | 250 | 165 (0.0165%) | 1,460,000 | |
| 19 | 17 | chlorine | Cl | 500 | 130 | 170 | 450 | 145 (0.0145%) | |
| 20 | 23 | vanadium | V | 100 | 160 | 190 | 120 (0.012%) | 76,000 | |
| 21 | 24 | chromium | Cr | 100 | 100 | 140 | 350 | 102 (0.0102%) | 26,000,000 |
| 22 | 37 | rubidium | Rb | 300 | 90 | 60 | 90 | ||
| 23 | 28 | nickel | Ni | 80 | 90 | 190 | 84 | 2,250,000 | |
| 24 | 30 | zinc | Zn | 75 | 79 | 70 | 11,900,000 | ||
| 25 | 29 | copper | Cu | 100 | 50 | 68 | 60 | 19,400,000 | |
| 26 | 58 | cerium | Ce | 68 | 60 | 66.5 | |||
| 27 | 60 | neodymium | Nd | 38 | 33 | 41.5 | |||
| 28 | 57 | lanthanum | La | 32 | 34 | 39 | |||
| 29 | 39 | yttrium | Y | 30 | 29 | 33 | 6,000 | ||
| 30 | 7 | nitrogen | N | 50 | 25 | 20 | 19 | 140,000,000 | |
| 31 | 27 | cobalt | Co | 20 | 30 | 25 | 123,000 | ||
| 32 | 21 | scandium | Sc | 16 | 26 | 22 | |||
| 33 | 3 | lithium | Li | 20 | 17 | 20 | 35,000 | ||
| 34 | 41 | niobium | Nb | 20 | 17 | 20 | 64,000 | ||
| 35 | 31 | gallium | Ga | 18 | 19 | 19 | 315 | ||
| 36 | 82 | lead | Pb | 14 | 10 | 14 | 4,820,000 | ||
| 37 | 5 | boron | B | 950 |
8.7 | 10 | 9,400,000 | ||
| 38 | 90 | thorium | Th | 12 | 6 | 9.6 | |||
| 39 | 59 | praseodymium | Pr | 9.5 | 8.7 | 9.2 | |||
| 40 | 62 | samarium | Sm | 7.9 | 6 | 7.05 | |||
| 41 | 64 | gadolinium | Gd | 7.7 | 5.2 | 6.2 | |||
| 42 | 66 | dysprosium | Dy | 6 | 6.2 | 5.2 | |||
| 43 | 68 | erbium | Er | 3.8 | 3.0 | 3.5 | |||
| 44 | 18 | argon | Ar | 3.5 | |||||
| 45 | 70 | ytterbium | Yb | 3.3 | 2.8 | 3.2 | |||
| 46 | 72 | hafnium | Hf | 5.3 | 3.3 | 3.0 | |||
| 47 | 55 | caesium | Cs | 3 | 1.9 | 3 | |||
| 48 | 4 | beryllium | Be | 2.6 | 1.9 | 2.8 | 220 | ||
| 49 | 92 | uranium | U | 0 | 1.8 | 2.7 | 74,119 | ||
| 50 | 35 | bromine | Br | 0.3700 | 3 | 2.4 | 391,000 | ||
| 51 | 50 | tin | Sn | 0 | 2.2 | 2.2 | 2.3 | 280,000 | |
| 52 | 73 | tantalum | Ta | 2 | 1.7 | 2.0 | 1,100 | ||
| 53 | 63 | europium | Eu | 2.1 | 1.8 | 2.0 | |||
| 54 | 33 | arsenic | As | 1.5 | 2.1 | 1.8 | 36,500 | ||
| 55 | 32 | germanium | Ge | 1.8 | 1.4 | 1.5 | 155 | ||
| 56 | 74 | tungsten | W | 160.6 |
1.1 | 1.25 | 86,400 | ||
| 57 | 67 | holmium | Ho | 1.4 | 1.2 | 1.3 | |||
| 58 | 42 | molybdenum | Mo | 1.5 | 1.1 | 1.2 | 227,000 | ||
| 59 | 65 | terbium | Tb | 1.1 | 0.9400 | 1.2 | |||
| 60 | 81 | thallium | Tl | 0.6000 | 0.5300 | 0.85 | 10 | ||
| 61 | 71 | lutetium | Lu | 0.8 | |||||
| 62 | 69 | thulium | Tm | 0.4800 | 0.4500 | 0.52 | |||
| 63 | 53 | iodine | I | 0.1400 | 0.4900 | 0.45 | 31,600 | ||
| 64 | 49 | indium | In | 0.0490 | 0.1600 | 0.25 | 655 | ||
| 65 | 51 | antimony | Sb | 0.2000 | 0.2000 | 0.2 | 130,000 | ||
| 66 | 48 | cadmium | Cd | 0.1100 | 0.1500 | 0.15 | 23,000 | ||
| 67 | 80 | mercury | Hg | 0.0500 | 0.0670 | 0.085 | 4,500 | ||
| 68 | 47 | silver | Ag | 0.0700 | 0.0800 | 0.075 | 27,000 | ||
| 69 | 34 | selenium | Se | 0.0500 | 0.0500 | 0.05 | 2,200 | ||
| 70 | 46 | palladium | Pd | 0.0006 | 0.0063 | 0.015 | 208 | ||
| 71 | 83 | bismuth | Bi | 0.0480 | 0.0250 | 0.0085 | 10,200 | ||
| 72 | 2 | helium | He | 0.008 | |||||
| 73 | 10 | neon | Ne | 0.0051 | |||||
| 74 | 78 | platinum | Pt | 0.0030 | 0.0037 | 0.005 | 172 | ||
| 75 | 79 | gold | Au | 0.0011 | 0.0031 | 0.004 | 3,100 | ||
| 76 | 76 | osmium | Os | 0.0001 | 0.0018 | 0.0015 | |||
| 77 | 52 | tellurium | Te | 0.0050 | 0.0010 | 0.001 | 2,200 | ||
| 78 | 44 | ruthenium | Ru | 0.0010 | 0.0010 | 0.001 | |||
| 79 | 77 | iridium | Ir | 0.0003 | 0.0004 | 0.001 | |||
| 80 | 45 | rhodium | Rh | 0.0002 | 0.0007 | 0.001 | |||
| 81 | 75 | rhenium | Re | 0.0004 | 0.0026 | 0.0007 | 47.2 | ||
| 82 | 36 | krypton | Kr | 0.0001 | |||||
| 83 | 54 | xenon | Xe | 0.00003 | |||||
| 84 | 91 | protactinium | Pa | 0.0000014 | |||||
| 85 | 88 | radium | Ra | 0.0000009 | |||||
| 86 | 84 | polonium | Po | 0.0000000002 | |||||
| 87 | 94 | plutonium | Pu | 0.00000000003 | |||||
| 88 | 93 | neptunium | Np | 0.000000000003 | |||||
| 89 | 43 | technetium | Tc | 0.00000000000135 | |||||
| 90 | 89 | actinium | Ac | 0.0000000000006 | |||||
| 91 | 86 | radon | Rn | 0.0000000000004 | |||||
| 92 | 61 | promethium | Pm | 0.00000000000000002 | |||||
| 93 | 87 | francium | Fr | 0.000000000000000001 | |||||
| 94 | 85 | astatine | At | 0.00000000000000000003 | |||||
See also
- Abundances of the elements (data page)
- Atmospheric chemistry
- Clarke number — lists of historical data and terminology
- List of chemical elements
- Primordial nuclide
References
- Anderson, Don L.; "Chemical Composition of the Mantle", Theory of the Earth, pp. 147-175 ISBN 0865421234
- David Kring, Composition of Earth's continental crust as inferred from the compositions of impact melt sheets, Lunar and Planetary Science XXVIII
- "Elements, Terrestrial Abundance". www.daviddarling.info. Archived from the original on 10 April 2007. Retrieved 2007-04-14.
- Barbalace, Kenneth. "Periodic Table of Elements". Environmental Chemistry.com. Retrieved 2007-04-14.
- "Abundance in Earth's Crust". WebElements.com. Archived from the original on 9 March 2007. Retrieved 2007-04-14.
- "List of Periodic Table Elements Sorted by Abundance in Earth's crust". Israel Science and Technology Homepage. Retrieved 2007-04-15.
- ABUNDANCE OF ELEMENTS IN THE EARTH’S CRUST AND IN THE SEA, CRC Handbook of Chemistry and Physics, 97th edition (2016–2017), p. 14-17
- Commodity Statistics and Information. USGS. All production numbers are for mines, except for Al, Cd, Fe, Ge, In, N, Se (plants, refineries), S (all forms) and As, Br, Mg, Si (unspecified). Data for B, K, Ti, Y are given not for the pure element but for the most common oxide, data for Na and Cl are for NaCl. For many elements like Si, Al, data are ambiguous (many forms produced) and are taken for the pure element. U data is pure element required for consumption by current reactor fleet . WNA.
- BookRags, Periodic Table.
- World Book Encyclopedia, Exploring Earth.
- HyperPhysics, Georgia State University, Abundance of Elements in Earth's Crust.
- Data Series 140, Historical Statistics for Mineral and Material Commodities in the United States, Version 2011, USGS .
- Eric Scerri, The Periodic Table, Its Story and Its Significance, Oxford University Press, 2007
This article is issued from Wikipedia. The text is licensed under Creative Commons - Attribution - Sharealike. Additional terms may apply for the media files.