Bayabas, Surigao del Sur
Bayabas, officially the Municipality of Bayabas (Surigaonon: Lungsod nan Bayabas; Tagalog: Bayan ng Bayabas), is a 5th class municipality in the province of Surigao del Sur, Philippines. According to the 2015 census, it has a population of 8,164 people. [3]
Bayabas | |
|---|---|
| Municipality of Bayabas | |
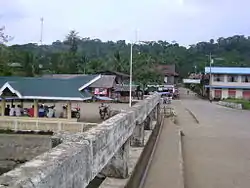 Highway showing a bridge on the main road of Bayabas | |
 Seal | |
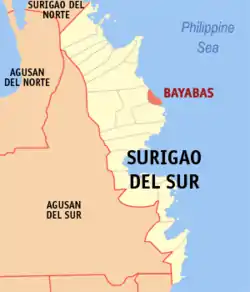 Map of Surigao del Sur with Bayabas highlighted | |
OpenStreetMap 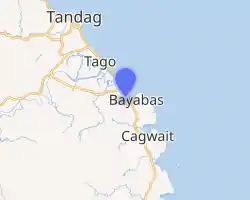
| |
.svg.png.webp) Bayabas Location within the Philippines | |
| Coordinates: 8°58′N 126°16′E | |
| Country | |
| Region | Caraga (Region XIII) |
| Province | Surigao del Sur |
| District | 1st District |
| Named for | Fruit Guava |
| Barangays | 7 (see Barangays) |
| Government | |
| • Type | Sangguniang Bayan |
| • Mayor | Maria Clarita Garcia-Limbaro |
| • Vice Mayor | Apolonio B. Lozada |
| • Representative | Prospero A. Pichay Jr. |
| • Electorate | 6,445 voters (2019) |
| Area | |
| • Total | 117.84 km2 (45.50 sq mi) |
| Elevation | 31 m (102 ft) |
| Population | |
| • Total | 8,164 |
| • Density | 69/km2 (180/sq mi) |
| • Households | 1,710 |
| Economy | |
| • Income class | 5th municipal income class |
| • Poverty incidence | 41.1% (2015)[4] |
| • Revenue | ₱51,856,165.84 (2016) |
| Time zone | UTC+8 (PST) |
| ZIP code | 8303 |
| PSGC | |
| IDD : area code | +63 (0)86 |
| Climate type | tropical rainforest climate |
| Native languages | Surigaonon Agusan Cebuano Tagalog |
| Website | www |
Geography
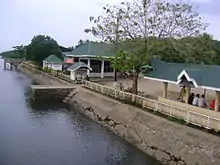
Bayabas is located between Tago and Cagwait. The Tago River separates the municipalities of Tago and Bayabas. Bayabas is consist of seven barangays mostly located along the coastlines. Though Bayabas is a small municipality, it is also abundant in natural resources especially seafoods.
Barangays
Bayabas is politically subdivided into 7 barangays.
Climate
Bayabas has a tropical rainforest climate (Af) with heavy to very heavy rainfall year-round and with extremely heavy rainfall in January.
| Climate data for Bayabas | |||||||||||||
|---|---|---|---|---|---|---|---|---|---|---|---|---|---|
| Month | Jan | Feb | Mar | Apr | May | Jun | Jul | Aug | Sep | Oct | Nov | Dec | Year |
| Average high °C (°F) | 28.9 (84.0) |
29.1 (84.4) |
30.0 (86.0) |
31.0 (87.8) |
31.8 (89.2) |
31.7 (89.1) |
31.7 (89.1) |
32.0 (89.6) |
32.0 (89.6) |
31.4 (88.5) |
30.5 (86.9) |
29.5 (85.1) |
30.8 (87.4) |
| Daily mean °C (°F) | 25.6 (78.1) |
25.6 (78.1) |
26.3 (79.3) |
27.0 (80.6) |
27.7 (81.9) |
27.5 (81.5) |
27.4 (81.3) |
27.7 (81.9) |
27.6 (81.7) |
27.2 (81.0) |
26.6 (79.9) |
26.0 (78.8) |
26.9 (80.3) |
| Average low °C (°F) | 22.3 (72.1) |
22.2 (72.0) |
22.6 (72.7) |
23.0 (73.4) |
23.7 (74.7) |
23.4 (74.1) |
23.2 (73.8) |
23.4 (74.1) |
23.2 (73.8) |
23.1 (73.6) |
22.8 (73.0) |
22.6 (72.7) |
23.0 (73.3) |
| Average rainfall mm (inches) | 730 (28.7) |
616 (24.3) |
456 (18.0) |
328 (12.9) |
260 (10.2) |
181 (7.1) |
186 (7.3) |
152 (6.0) |
169 (6.7) |
208 (8.2) |
454 (17.9) |
629 (24.8) |
4,369 (172.1) |
| Source: Climate-Data.org[5] | |||||||||||||
History
World War II
During 1943 and 1944 much of the east coast of Mindanao was occupied by the Japanese. Bayabas was not occupied, although at times Japanese navy ships anchored in the harbor off the coast of the town. As the Japanese occupied an increasing number of area coastal towns, refugees trickled into town. The prewar rector of San Nicolas School, in Surigao City, was one of a number of priests who sought refuge in Bayabas. Food supplies soon failed to reach town from the outside, since Japanese troops disrupted distribution.[6]
Demographics
| Year | Pop. | ±% p.a. |
|---|---|---|
| 1970 | 4,810 | — |
| 1975 | 4,859 | +0.20% |
| 1980 | 5,881 | +3.89% |
| 1990 | 6,259 | +0.62% |
| 1995 | 6,423 | +0.49% |
| 2000 | 7,706 | +3.98% |
| 2007 | 7,439 | −0.49% |
| 2010 | 7,779 | +1.64% |
| 2015 | 8,164 | +0.92% |
| Source: Philippine Statistics Authority [3] [7] [8][9] | ||
References
- Municipality of Bayabas | (DILG)
- "Province: Surigao del Sur". PSGC Interactive. Quezon City, Philippines: Philippine Statistics Authority. Retrieved 12 November 2016.
- Census of Population (2015). "Caraga". Total Population by Province, City, Municipality and Barangay. PSA. Retrieved 20 June 2016.
- "PSA releases the 2015 Municipal and City Level Poverty Estimates". Quezon City, Philippines. Retrieved 12 October 2019.
- "Climate: Bayabas". Climate-Data.org. Retrieved 26 October 2020.
- Virginia Hansen Holmes, Guerrilla Daughter (Kent, Ohio: Kent State U. Press, 2009), pp. 141-1, 166, 205.
- Census of Population and Housing (2010). "Caraga". Total Population by Province, City, Municipality and Barangay. NSO. Retrieved 29 June 2016.
- Censuses of Population (1903–2007). "Caraga". Table 1. Population Enumerated in Various Censuses by Province/Highly Urbanized City: 1903 to 2007. NSO.
- "Province of Surigao del Sur". Municipality Population Data. Local Water Utilities Administration Research Division. Retrieved 17 December 2016.
External links
| Wikimedia Commons has media related to Bayabas, Surigao del Sur. |
- Bayabas Profile at PhilAtlas.com
- Philippine Standard Geographic Code
- Philippine Census Information
- Local Governance Performance Management System
Places adjacent to Bayabas, Surigao del Sur | ||||||||||
|---|---|---|---|---|---|---|---|---|---|---|
| ||||||||||