Berlin Marzahn – Hellersdorf
Berlin Marzahn – Hellersdorf is an electoral constituency (German: Wahlkreis) represented in the Bundestag. It elects one member via first-past-the-post voting. Under the current constituency numbering system, it is designated as constituency 85. It is located in eastern Berlin, comprising the Marzahn-Hellersdorf borough.[1]
| 85 Berlin Marzahn – Hellersdorf | |
|---|---|
| electoral district for the Bundestag | |
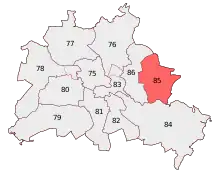 Berlin Marzahn – Hellersdorf in 2013 | |
| State | Berlin |
| Population | 256,300 (2015) |
| Electorate | 200,704 (2017) |
| Area | 61.9 km2 |
| Current electoral district | |
| Created | 1990 |
| Party | LINKE |
| Member | Petra Pau |
| Elected | 2002, 2005, 2009, 2013, 2017 |
Berlin Marzahn – Hellersdorf was created for the inaugural 1990 federal election after German reunification. Since 2002, it has been represented by Petra Pau of The Left.[2]
Geography
Berlin Marzahn – Hellersdorf is located in eastern Berlin. As of the 2021 federal election, it is coterminous with the Marzahn-Hellersdorf borough.[1]
History
Berlin Marzahn – Hellersdorf was created after German reunification in 1990. Until 2002, it was named Berlin Hellersdorf – Marzahn. In the 1990 election, it was constituency 261 in the numbering system. In the 1994 and 1998 elections, it was number 260. In the 2002 through 2009 elections, it was number 86. Since the 2013 election, it has been number 85. Its borders have not changed since its creation.
Members
The constituency was first represented by Gregor Gysi of the Party of Democratic Socialism (PDS) from 1990 to 2002. He was succeeded by fellow PDS member Petra Pau in 2002. After the PDS merged into The Left, Pau contested the constituency for that party and was re-elected in 2005. She was elected Vice President of the Bundestag in 2006. Pau was subsequently re-elected in Berlin Marzahn – Hellersdorf in 2009, 2013, and 2017.
| Election | Member | Party | % | |
|---|---|---|---|---|
| 1990 | Gregor Gysi | PDS | 31.7 | |
| 1994 | 48.9 | |||
| 1998 | 46.7 | |||
| 2002 | Petra Pau | PDS | 37.7 | |
| 2005 | LINKE | 42.6 | ||
| 2009 | 47.6 | |||
| 2013 | 38.9 | |||
| 2017 | 34.2 | |||
Election results
2017 election
| Federal election (2017): Berlin Marzahn – Hellersdorf[3] | |||||||||
|---|---|---|---|---|---|---|---|---|---|
| Notes: |
Blue background denotes the winner of the electorate vote.
| ||||||||
| Party | Candidate | Votes | % | ±% | Party votes | % | ±% | ||
| Left | 46,782 | 34.2 | 35,698 | 26.1 | |||||
| CDU | Monika Grütters | 30,480 | 22.3 | 28,620 | 20.9 | ||||
| AfD | Jeannette Auricht | 28,167 | 20.6 | 29,618 | 21.6 | ||||
| SPD | Dmitri Geidel | 17,172 | 12.6 | 19,797 | 14.5 | ||||
| FDP | Roman-Francesco Rogat | 4,852 | 3.5 | 7,290 | 5.3 | ||||
| Green | Inka Seidel-Grothe | 4,440 | 3.2 | 5,621 | 7.1 | ||||
| Tierschutzpartei | 2,378 | 1.7 | |||||||
| PARTEI | 2,216 | 1.6 | |||||||
| FW | Detlef Zelinski | 2,010 | 1.5 | 899 | 0.7 | ||||
| Die Grauen | Marianne Seipp | 1,470 | 1.1 | 1,398 | 1.0 | ||||
| MIETERPARTEI | Steffen Doebert | 716 | 0.5 | ||||||
| Pirates | 693 | 0.5 | |||||||
| NPD | Andreas Käfer | 595 | 0.5 | ||||||
| Gesundheitsforschung | 577 | 0.4 | |||||||
| DM | 336 | 0.2 | |||||||
| DiB | 328 | 0.2 | |||||||
| BGE | 320 | 0.2 | |||||||
| Menschliche Welt | 227 | 0.2 | |||||||
| DKP | 197 | 0.1 | |||||||
| ÖDP | 160 | 0.1 | |||||||
| du. | 156 | 0.1 | |||||||
| V-Partei³ | 146 | 0.1 | |||||||
| MLPD | 106 | 0.1 | |||||||
| BüSo | 95 | 0.1 | |||||||
| SGP | 43 | 0.0 | |||||||
| B* | 20 | 0.0 | |||||||
| Informal votes | 2,207 | 2,053 | |||||||
| Total Valid votes | 136,785 | 136,939 | |||||||
| Turnout | 138,992 | 69.3 | |||||||
| Left hold | Majority | 16,302 | 11.9 | ||||||
2013 election
| Federal election (2013): Berlin Marzahn – Hellersdorf[4] | |||||||||
|---|---|---|---|---|---|---|---|---|---|
| Notes: |
Blue background denotes the winner of the electorate vote.
| ||||||||
| Party | Candidate | Votes | % | ±% | Party votes | % | ±% | ||
| Left | 50,866 | 38.9 | 43,026 | 32.9 | |||||
| CDU | Monika Grütters | 33,552 | 25.7 | 33,947 | 26.0 | ||||
| SPD | Iris Spranger | 22,341 | 17.1 | 25,103 | 19.2 | ||||
| AfD | Robin Ebser | 6,347 | 4.9 | 8,319 | 6.4 | ||||
| NPD | Fritz Liebenow | 5,540 | 4.2 | 5,101 | 3.9 | ||||
| Green | Stefan Ziller | 4,071 | 3.1 | 5,068 | 3.9 | ||||
| Pirates | Björn Glienke | 3,668 | 2.8 | 3,996 | 3.1 | ||||
| FDP | Tom Wesener | 938 | 0.7 | 2,278 | 1.7 | ||||
| PRO | Manfred Rouhs | 1,101 | 0.8 | 1,116 | 0.9 | ||||
| PARTEI | Lea Joy Friedel | 860 | 0.7 | 1,114 | 0.9 | ||||
| FW | Matthias Schmidt | 717 | 0.5 | 752 | 0.6 | ||||
| Independent | André Otto | 499 | 0.4 | ||||||
| REP | 243 | 0.2 | |||||||
| ÖDP | 202 | 0.1 | |||||||
| BüSo | Stefan Tolksdorf | 239 | 0.2 | 181 | 0.1 | ||||
| MLPD | 111 | 0.1 | |||||||
| PSG | 102 | 0.1 | |||||||
| BIG | 73 | 0.1 | |||||||
| Informal votes | 2,078 | 2,085 | |||||||
| Total Valid votes | 130,739 | 130,732 | |||||||
| Turnout | 132,817 | 65.1 | |||||||
| Left hold | Majority | 17,314 | 13.2 | ||||||
2009 election
| Federal election (2009): Berlin Marzahn – Hellersdorf[5] | |||||||||
|---|---|---|---|---|---|---|---|---|---|
| Notes: |
Blue background denotes the winner of the electorate vote.
| ||||||||
| Party | Candidate | Votes | % | ±% | Party votes | % | ±% | ||
| Left | 60,236 | 47.7 | 51,662 | 40.8 | |||||
| CDU | Monika Grütters | 24,563 | 19.4 | 22,875 | 18.1 | ||||
| SPD | Rudolf Kujath | 20,336 | 16.1 | 20,906 | 16.5 | ||||
| Green | Stefan Ziller | 7,242 | 5.7 | 8,847 | 7.0 | ||||
| FDP | Klaus Große | 6,969 | 5.5 | 9,741 | 7.7 | ||||
| Pirates | 4,274 | 3.4 | |||||||
| NPD | Matthias Wichmann | 4,725 | 3.7 | 3,832 | 3.0 | ||||
| Tierschutzpartei | 2,189 | 1.7 | |||||||
| BüSo | Stefan Tolksdorf | 1,564 | 1.2 | 579 | 0.5 | ||||
| Independent | Jürgen Beck | 766 | 0.6 | ||||||
| REP | 456 | 0.4 | |||||||
| DVU | 356 | 0.3 | |||||||
| DIE VIOLETTEN | 249 | 0.2 | |||||||
| DKP | 235 | 0.2 | |||||||
| ÖDP | 189 | 0.1 | |||||||
| PSG | 156 | 0.1 | |||||||
| MLPD | 127 | 0.1 | |||||||
| Informal votes | 2,496 | 2,224 | |||||||
| Total Valid votes | 126,401 | 126,673 | |||||||
| Turnout | 128,897 | 63.4 | |||||||
| Left hold | Majority | 35,673 | 28.3 | ||||||
References
- "Constituency Berlin Marzahn – Hellersdorf". Federal Returning Officer.
- "Results for Berlin Marzahn – Hellersdorf". Federal Returning Officer.
- Results for Berlin Marzahn – Hellersdorf
- Results for Berlin Marzahn – Hellersdorf
- Results for Berlin Marzahn – Hellersdorf
| Current |
|
|---|---|
| Other states |
|
| See also | |