Berlin Neukölln
Berlin Neukölln is an electoral constituency (German: Wahlkreis) represented in the Bundestag. It elects one member via first-past-the-post voting. Under the current constituency numbering system, it is designated as constituency 82. It is located in southern Berlin, comprising the Neukölln borough.[1]
| 82 Berlin Neukölln | |
|---|---|
| electoral district for the Bundestag | |
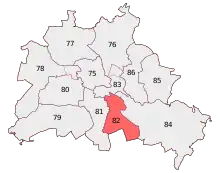 Berlin Neukölln in 2013 | |
| State | Berlin |
| Population | 318,700 (2015) |
| Electorate | 202,618 (2017) |
| Area | 45.0 km2 |
| Current electoral district | |
| Created | 1990 |
| Party | SPD |
| Member | Fritz Felgentreu |
| Elected | 2013, 2017 |
Berlin Neukölln was created for the inaugural 1990 federal election after German reunification. Since 2013, it has been represented by Fritz Felgentreu of the Social Democratic Party (SPD).[2]
Geography
Berlin Neukölln is located in southern Berlin. As of the 2021 federal election, it is coterminous with the Neukölln borough.[1]
History
Berlin Neukölln was created after German reunification in 1990. In the 1990 election, it was constituency 256 in the numbering system. In the 1994 and 1998 elections, it was number 257. In the 2005 through 2009 elections, it was number 83. Since the 2013 election, it has been number 82. Its borders have not changed since its creation.
Members
The constituency was first represented by Dankward Buwitt of the Christian Democratic Union (CDU) from 1990 to 1998. It was won by the Social Democratic Party (SPD) in 1998 and represented by Ditmar Staffelt. In 2009, Stefanie Vogelsang of the CDU was elected, and served a single term. Fritz Felgentreu regained the constituency for the SPD in the 2013 election, and was re-elected in 2017.
| Election | Member | Party | % | |
|---|---|---|---|---|
| 1990 | Dankward Buwitt | CDU | 51.2 | |
| 1994 | 42.2 | |||
| 1998 | Ditmar Staffelt | SPD | 48.5 | |
| 2002 | 41.9 | |||
| 2005 | 39.3 | |||
| 2009 | Stefanie Vogelsang | CDU | 30.8 | |
| 2013 | Fritz Felgentreu | SPD | 32.3 | |
| 2017 | 26.8 | |||
Election results
2017 election
| Federal election (2017): Berlin Neukölln[3] | |||||||||
|---|---|---|---|---|---|---|---|---|---|
| Notes: |
Blue background denotes the winner of the electorate vote.
| ||||||||
| Party | Candidate | Votes | % | ±% | Party votes | % | ±% | ||
| SPD | 37,777 | 26.8 | 27,520 | 19.5 | |||||
| CDU | Christina Schwarzer | 34,593 | 24.5 | 31,592 | 22.3 | ||||
| Left | Judith Benda | 23,204 | 16.4 | 25,752 | 18.2 | ||||
| Green | Susanna Kahlefeld | 15,480 | 11.0 | 18,446 | 13.0 | ||||
| AfD | Frank-Christian Hansel | 15,105 | 10.7 | 15,904 | 11.2 | ||||
| FDP | Marcus Jensen | 7,255 | 5.1 | 10,891 | 7.7 | ||||
| PARTEI | Antonietta Miro | 5,048 | 3.6 | 3,490 | 2.5 | ||||
| Tierschutzpartei | 2,171 | 1.5 | |||||||
| Pirates | 964 | 0.7 | |||||||
| Die Grauen | 1,191 | 0.8 | 919 | 0.6 | |||||
| DiB | 724 | 0.5 | |||||||
| BGE | 676 | 0.5 | |||||||
| DM | 366 | 0.3 | |||||||
| MIETERPARTEI | 636 | 0.5 | |||||||
| du. | 335 | 0.2 | |||||||
| Menschliche Welt | 270 | 0.2 | |||||||
| NPD | 262 | 0.2 | |||||||
| Gesundheitsforschung | 248 | 0.2 | |||||||
| FW | 220 | 0.2 | |||||||
| ÖDP | 208 | 0.1 | |||||||
| V-Partei³ | 198 | 0.1 | |||||||
| MLPD | 294 | 0.2 | 196 | 0.1 | |||||
| BüSo | Jonathan Thron | 260 | 0.2 | 111 | 0.1 | ||||
| DKP | 99 | 0.1 | |||||||
| B* | 83 | 0.1 | |||||||
| SGP | 30 | 0.0 | |||||||
| Informal votes | 2,448 | 2,140 | |||||||
| Total Valid votes | 141,105 | 141,413 | |||||||
| Turnout | 143,553 | 70.8 | |||||||
| SPD hold | Majority | 3,184 | 2.3 | ||||||
2013 election
| Federal election (2013): Berlin Neukölln[4] | |||||||||
|---|---|---|---|---|---|---|---|---|---|
| Notes: |
Blue background denotes the winner of the electorate vote.
| ||||||||
| Party | Candidate | Votes | % | ±% | Party votes | % | ±% | ||
| SPD | Fritz Felgentreu | 44,528 | 32.3 | 36,211 | 26.2 | ||||
| CDU | Christina Schwarzer | 42,092 | 30.6 | 40,038 | 29.0 | ||||
| Left | Ruben Lehnert | 16,144 | 11.7 | 19,677 | 14.3 | ||||
| Green | Anja Kofbinger | 16,126 | 11.7 | 19,156 | 13.9 | ||||
| Pirates | Anne Helm | 6,094 | 4.4 | 5,654 | 4.1 | ||||
| AfD | Sari-Christoph Saleh | 4,140 | 3.0 | 5,832 | 4.2 | ||||
| NPD | Jan Sturm | 3,094 | 2.2 | 2,627 | 1.9 | ||||
| PARTEI | Georg Friedrich Kammerer | 2,420 | 1.8 | 2,060 | 1.5 | ||||
| FDP | Sebastian Kluckert | 1,861 | 1.4 | 4,122 | 3.0 | ||||
| FW | 794 | 0.6 | 689 | 0.5 | |||||
| BIG | 617 | 0.4 | |||||||
| PRO | 454 | 0.3 | |||||||
| ÖDP | 255 | 0.2 | |||||||
| REP | 216 | 0.2 | |||||||
| BüSo | 222 | 0.2 | 126 | 0.1 | |||||
| MLPD | 208 | 0.2 | 143 | 0.1 | |||||
| PSG | 80 | 0.1 | |||||||
| Informal votes | 3,102 | 2,868 | |||||||
| Total Valid votes | 137,723 | 137,957 | |||||||
| Turnout | 140,825 | 68.5 | |||||||
| SPD gain from CDU | Majority | 2,436 | 1.7 | ||||||
2009 election
| Federal election (2009): Berlin Neukölln[5] | |||||||||
|---|---|---|---|---|---|---|---|---|---|
| Notes: |
Blue background denotes the winner of the electorate vote.
| ||||||||
| Party | Candidate | Votes | % | ±% | Party votes | % | ±% | ||
| CDU | Stefanie Vogelsang | 39,618 | 30.8 | 33,469 | 25.9 | ||||
| SPD | Fritz Felgentreu | 35,168 | 27.3 | 27,639 | 21.4 | ||||
| Green | Anja Kofbinger | 18,805 | 14.6 | 22,698 | 17.6 | ||||
| Left | Ruben Lehnert | 15,852 | 12.3 | 17,986 | 13.9 | ||||
| FDP | Andreas Lück | 11,468 | 8.9 | 16,486 | 12.8 | ||||
| Pirates | 4,339 | 4.3 | |||||||
| NPD | Jan Sturm | 3,356 | 2.6 | 2,554 | 2.0 | ||||
| Tierschutzpartei | 2,066 | 1.6 | |||||||
| Independent | Yusuf Bayrak | 1,924 | 1.5 | ||||||
| Independent | Annette Köhn | 1,305 | 1.0 | ||||||
| REP | 611 | 0.5 | |||||||
| DIE VIOLETTEN | 394 | 0.3 | |||||||
| Independent | Sven Buchmann | 388 | 0.3 | ||||||
| Independent | Bülent Yorulmaz | 316 | 0.2 | ||||||
| ÖDP | 261 | 0.2 | |||||||
| BüSo | 209 | 0.2 | |||||||
| DVU | 158 | 0.1 | |||||||
| DKP | Rainer Perschewski | 280 | 0.2 | 150 | 0.1 | ||||
| PSG | 128 | 0.1 | |||||||
| MLPD | Andrew Schlüter | 218 | 0.2 | 108 | 0.1 | ||||
| Informal votes | 3,915 | 3,357 | |||||||
| Total Valid votes | 128,698 | 129,256 | |||||||
| Turnout | 132,613 | 67.2 | |||||||
| CDU gain from SPD | Majority | 4,450 | 3.5 | ||||||
References
- "Constituency Berlin Neukölln". Federal Returning Officer.
- "Results for Berlin Neukölln". Federal Returning Officer.
- Results for Berlin Neukölln
- Results for Berlin Neukölln
- Results for Berlin Neukölln
| Current |
|
|---|---|
| Other states |
|
| See also | |