Berlin Reinickendorf
Berlin Reinickendorf is an electoral constituency (German: Wahlkreis) represented in the Bundestag. It elects one member via first-past-the-post voting. Under the current constituency numbering system, it is designated as constituency 77. It is located in northern Berlin, comprising the Reinickendorf borough.[1]
| 77 Berlin Reinickendorf | |
|---|---|
| electoral district for the Bundestag | |
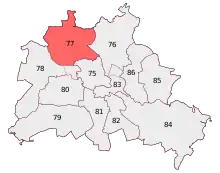 Berlin Reinickendorf in 2013 | |
| State | Berlin |
| Population | 252,100 (2015) |
| Electorate | 182,398 (2017) |
| Area | 89.4 km2 |
| Current electoral district | |
| Created | 1990 |
| Party | CDU |
| Member | Frank Steffel |
| Elected | 2009, 2013, 2017 |
Berlin Reinickendorf was created for the inaugural 1990 federal election after German reunification. Since 2009, it has been represented by Frank Steffel of the Christian Democratic Union (CDU).[2]
Geography
Berlin Reinickendorf is located in northern Berlin. As of the 2021 federal election, it is coterminous with the Reinickendorf borough.[1]
History
Berlin Reinickendorf was created after German reunification in 1990. In the 1990 election, it was constituency 250 in the numbering system. In the 1994 and 1998 elections, it was number 251. In the 2002 through 2009 elections, it was number 78. Since the 2013 election, it has been number 77. Its borders have not changed since its creation.
Members
The constituency was first represented by Gabriele Wiechatzek of the Christian Democratic Union (CDU) from 1990 to 1994, followed by Diethard Schütze from 1994 to 1998. It was won by the Social Democratic Party (SPD) in 1998 and represented by Detlef Dzembritzki until 2009. Frank Steffel of the CDU was elected in 2009, and re-elected in 2013 and 2017.
| Election | Member | Party | % | |
|---|---|---|---|---|
| 1990 | Gabriele Wiechatzek | CDU | 54.4 | |
| 1994 | Diethard Schütze | CDU | 47.4 | |
| 1998 | Detlef Dzembritzki | SPD | 47.7 | |
| 2002 | 42.5 | |||
| 2005 | 42.5 | |||
| 2009 | Frank Steffel | CDU | 39.0 | |
| 2013 | 45.0 | |||
| 2017 | 36.8 | |||
Election results
2017 election
| Federal election (2017): Berlin Reinickendorf[3] | |||||||||
|---|---|---|---|---|---|---|---|---|---|
| Notes: |
Blue background denotes the winner of the electorate vote.
| ||||||||
| Party | Candidate | Votes | % | ±% | Party votes | % | ±% | ||
| CDU | 49,654 | 36.8 | 41,912 | 31.0 | |||||
| SPD | Thorsten Karge | 31,882 | 23.6 | 27,071 | 20.0 | ||||
| AfD | Dieter Neuendorf | 17,738 | 13.2 | 18,513 | 13.7 | ||||
| Green | Stefanie Remlinger | 10,647 | 7.9 | 12,305 | 9.1 | ||||
| Left | Hakan Taș | 10,384 | 7.7 | 11,516 | 8.5 | ||||
| FDP | Juliane Hüttl | 9,688 | 7.2 | 15,376 | 11.4 | ||||
| PARTEI | Bastian Badran | 2,828 | 2.1 | 1,943 | 1.4 | ||||
| Tierschutzpartei | 1,938 | 1.4 | |||||||
| Die Grauen | Michael Schulz | 1,639 | 1.2 | 1,362 | 1.0 | ||||
| Pirates | 682 | 0.5 | |||||||
| BGE | 319 | 0.2 | |||||||
| DM | 306 | 0.2 | |||||||
| FW | 298 | 0.2 | |||||||
| DiB | 279 | 0.2 | |||||||
| Gesundheitsforschung | 247 | 0.2 | |||||||
| ÖDP | 231 | 0.2 | |||||||
| Menschliche Welt | 203 | 0.2 | |||||||
| du. | 165 | 0.1 | |||||||
| V-Partei³ | 135 | 0.1 | |||||||
| BüSo | Matthias Woelki | 400 | 0.3 | 114 | 0.1 | ||||
| MLPD | 83 | 0.1 | |||||||
| DKP | 44 | 0.0 | |||||||
| SGP | 32 | 0.0 | |||||||
| B* | 31 | 0.0 | |||||||
| Informal votes | 2,380 | 2,135 | |||||||
| Total Valid votes | 134,860 | 135,105 | |||||||
| Turnout | 137,240 | 75.2 | |||||||
| CDU hold | Majority | 17,772 | 13.2 | ||||||
2013 election
| Federal election (2013): Berlin Reinickendorf[4] | |||||||||
|---|---|---|---|---|---|---|---|---|---|
| Notes: |
Blue background denotes the winner of the electorate vote.
| ||||||||
| Party | Candidate | Votes | % | ±% | Party votes | % | ±% | ||
| CDU | 58,845 | 45.0 | 52,545 | 40.1 | |||||
| SPD | Jörg Stroedter | 38,593 | 29.5 | 34,571 | 26.4 | ||||
| Green | Holger Lütge | 8,790 | 6.7 | 11,427 | 8.7 | ||||
| Left | Hakan Taş | 8,508 | 6.5 | 10,394 | 7.9 | ||||
| AfD | Ralf-Günther Conradi | 5,852 | 4.5 | 7,906 | 6.0 | ||||
| Pirates | Gerd Lindenblatt | 3,251 | 2.5 | 3,417 | 2.6 | ||||
| FDP | Mieke Senftleben | 2,605 | 2.0 | 5,708 | 4.4 | ||||
| NPD | André Markau | 2,254 | 1.7 | 1,976 | 1.5 | ||||
| PARTEI | Feline Kuck | 865 | 0.7 | 1,074 | 0.8 | ||||
| Independent | Frank Ditsche | 694 | 0.5 | ||||||
| FW | Detlef Dorn | 624 | 0.5 | 661 | 0.5 | ||||
| PRO | 449 | 0.3 | |||||||
| REP | 310 | 0.2 | |||||||
| ÖDP | 240 | 0.2 | |||||||
| BIG | 209 | 0.2 | |||||||
| BüSo | 75 | 0.1 | |||||||
| PSG | 50 | 0.0 | |||||||
| MLPD | 44 | 0.0 | |||||||
| Informal votes | 2,603 | 2,428 | |||||||
| Total Valid votes | 130,881 | 131,056 | |||||||
| Turnout | 133,484 | 73.0 | |||||||
| CDU hold | Majority | 20,252 | 15.5 | ||||||
2009 election
| Federal election (2009): Berlin Reinickendorf[5] | |||||||||
|---|---|---|---|---|---|---|---|---|---|
| Notes: |
Blue background denotes the winner of the electorate vote.
| ||||||||
| Party | Candidate | Votes | % | ±% | Party votes | % | ±% | ||
| CDU | Frank Steffel | 50,554 | 39.0 | 42,771 | 32.9 | ||||
| SPD | Jörg Stroedter | 35,540 | 27.4 | 27,842 | 21.4 | ||||
| Green | Anke Petters | 13,875 | 10.7 | 17,577 | 13.5 | ||||
| FDP | Mieke Senftleben | 13,711 | 10.6 | 20,580 | 15.8 | ||||
| Left | Felix Lederle | 10,525 | 8.1 | 12,060 | 9.3 | ||||
| Pirates | 2,979 | 2.3 | |||||||
| NPD | André Markau | 2,613 | 2.0 | 2,074 | 1.6 | ||||
| Tierschutzpartei | 1,946 | 1.5 | |||||||
| Independent | Frank Holger Kurt Ditsche | 1,267 | 1.0 | ||||||
| REP | 772 | 0.6 | |||||||
| Independent | Dennis Hempel | 529 | 0.4 | ||||||
| BüSo | Frank Scholz | 879 | 0.7 | 372 | 0.3 | ||||
| DIE VIOLETTEN | 340 | 0.3 | |||||||
| ÖDP | 246 | 0.2 | |||||||
| DVU | 165 | 0.1 | |||||||
| PSG | 76 | 0.1 | |||||||
| DKP | 36 | 0.1 | |||||||
| MLPD | 30 | 0.1 | |||||||
| Informal votes | 3,039 | 2,666 | |||||||
| Total Valid votes | 129,493 | 129,866 | |||||||
| Turnout | 132,532 | 72.4 | |||||||
| CDU gain from SPD | Majority | 15,014 | 11.6 | ||||||
References
- "Constituency Berlin Reinickendorf". Federal Returning Officer.
- "Results for Berlin Reinickendorf". Federal Returning Officer.
- Results for Berlin Reinickendorf
- Results for Berlin Reinickendorf
- Results for Berlin Reinickendorf
| Current |
|
|---|---|
| Other states |
|
| See also | |