Buldon
Buldon, officially the Municipality of Buldon (Maguindanaon: Ingud nu Buldon; Iranun: Inged a Buldon; Tagalog: Bayan ng Buldon), is a 4th class municipality in the province of Maguindanao, Philippines. According to the 2015 census, it has a population of 35,282 people. [3]
Buldon | |
|---|---|
| Municipality of Buldon | |
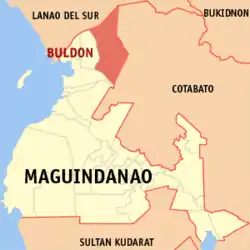 Map of Maguindanao with Buldon highlighted | |
OpenStreetMap 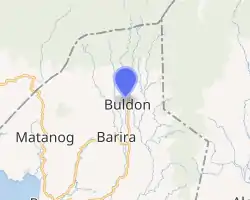
| |
.svg.png.webp) Buldon Location within the Philippines | |
| Coordinates: 7°31′N 124°22′E | |
| Country | |
| Region | Bangsamoro Autonomous Region in Muslim Mindanao (BARMM) |
| Province | Maguindanao |
| District | 1st District |
| Barangays | 15 (see Barangays) |
| Government | |
| • Type | Sangguniang Bayan |
| • Mayor | Abolais A. Manalao |
| • Vice Mayor | Cairoden P. Pangunotan |
| • Representative | Datu Roonie Q. Sinsuat Sr. |
| • Electorate | 20,043 voters (2019) |
| Area | |
| • Total | 392.61 km2 (151.59 sq mi) |
| Elevation | 408 m (1,339 ft) |
| Highest elevation | 809 m (2,654 ft) |
| Lowest elevation | 198 m (650 ft) |
| Population | |
| • Total | 35,282 |
| • Density | 90/km2 (230/sq mi) |
| • Households | 5,540 |
| Economy | |
| • Income class | 4th municipal income class |
| • Poverty incidence | 60.79% (2015)[4] |
| • Revenue | ₱120,610,006.61 (2016) |
| Service provider | |
| • Electricity | Maguindanao Electric Cooperative |
| Time zone | UTC+8 (PST) |
| ZIP code | 9615 |
| PSGC | |
| IDD : area code | +63 (0)64 |
| Climate type | tropical climate |
| Native languages | Maguindanao Maranao Tagalog |
| Website | www |
The town was part of the province of Shariff Kabunsuan from October 2006 until its nullification by the Supreme Court in July 2008.
Geography
Barangays
Buldon is politically subdivided into 15 barangays.
- Ampuan
- Aratuc
- Cabayuan
- Calaan (Poblacion)
- Karim
- Dinganen
- Edcor (Gallego Edcor)
- Kulimpang
- Mataya
- Minabay
- Nuyo
- Oring
- Pantawan
- Piers
- Rumidas
Climate
| Climate data for Buldon, Maguindanao | |||||||||||||
|---|---|---|---|---|---|---|---|---|---|---|---|---|---|
| Month | Jan | Feb | Mar | Apr | May | Jun | Jul | Aug | Sep | Oct | Nov | Dec | Year |
| Average high °C (°F) | 28 (82) |
28 (82) |
28 (82) |
29 (84) |
28 (82) |
27 (81) |
27 (81) |
27 (81) |
27 (81) |
27 (81) |
27 (81) |
28 (82) |
28 (82) |
| Average low °C (°F) | 22 (72) |
22 (72) |
22 (72) |
23 (73) |
23 (73) |
23 (73) |
22 (72) |
22 (72) |
22 (72) |
22 (72) |
23 (73) |
22 (72) |
22 (72) |
| Average precipitation mm (inches) | 236 (9.3) |
225 (8.9) |
244 (9.6) |
235 (9.3) |
304 (12.0) |
287 (11.3) |
200 (7.9) |
175 (6.9) |
158 (6.2) |
200 (7.9) |
287 (11.3) |
243 (9.6) |
2,794 (110.2) |
| Average rainy days | 24.3 | 22.3 | 26.0 | 27.2 | 28.3 | 27.2 | 25.8 | 24.8 | 22.2 | 25.4 | 27.2 | 25.8 | 306.5 |
| Source: Meteoblue (modeled/calculated data, not measured locally)[5] | |||||||||||||
Demographics
|
| |||||||||||||||||||||||||||||||||||||||
| Source: Philippine Statistics Authority [3] [6] [7][8] | ||||||||||||||||||||||||||||||||||||||||
References
- Municipality of Buldon | (DILG)
- "Province: Maguindanao". PSGC Interactive. Quezon City, Philippines: Philippine Statistics Authority. Retrieved 12 November 2016.
- Census of Population (2015). "ARMM – Autonomous Region in Muslim Mindanao". Total Population by Province, City, Municipality and Barangay. PSA. Retrieved 20 June 2016.
- https://psa.gov.ph/sites/default/files/City%20and%20Municipal-level%20Small%20Area%20Poverty%20Estimates_%202009%2C%202012%20and%202015_0.xlsx; publication date: 10 July 2019; publisher: Philippine Statistics Authority.
- "Buldon, Maguindanao : Average Temperatures and Rainfall". Meteoblue. Retrieved 19 January 2019.
- Census of Population and Housing (2010). "ARMM – Autonomous Region in Muslim Mindanao". Total Population by Province, City, Municipality and Barangay. NSO. Retrieved 29 June 2016.
- Censuses of Population (1903–2007). "ARMM – Autonomous Region in Muslim Mindanao". Table 1. Population Enumerated in Various Censuses by Province/Highly Urbanized City: 1903 to 2007. NSO.
- "Province of Maguindanao". Municipality Population Data. Local Water Utilities Administration Research Division. Retrieved 17 December 2016.
- "Poverty incidence (PI):". Philippine Statistics Authority. Retrieved 28 December 2020.
- https://psa.gov.ph/sites/default/files/NSCB_LocalPovertyPhilippines_0.pdf; publication date: 29 November 2005; publisher: Philippine Statistics Authority.
- https://psa.gov.ph/sites/default/files/2003%20SAE%20of%20poverty%20%28Full%20Report%29_1.pdf; publication date: 23 March 2009; publisher: Philippine Statistics Authority.
- https://psa.gov.ph/sites/default/files/2006%20and%202009%20City%20and%20Municipal%20Level%20Poverty%20Estimates_0_1.pdf; publication date: 3 August 2012; publisher: Philippine Statistics Authority.
- https://psa.gov.ph/sites/default/files/2012%20Municipal%20and%20City%20Level%20Poverty%20Estima7tes%20Publication%20%281%29.pdf; publication date: 31 May 2016; publisher: Philippine Statistics Authority.
- https://psa.gov.ph/sites/default/files/City%20and%20Municipal-level%20Small%20Area%20Poverty%20Estimates_%202009%2C%202012%20and%202015_0.xlsx; publication date: 10 July 2019; publisher: Philippine Statistics Authority.
External links
- Buldon Profile at PhilAtlas.com
- Philippine Standard Geographic Code
- Philippine Census Information
- Local Governance Performance Management System
Places adjacent to Buldon | |
|---|---|
Buluan (capital) | |
| Municipalities |
|
| Independent component city |
|
This article is issued from Wikipedia. The text is licensed under Creative Commons - Attribution - Sharealike. Additional terms may apply for the media files.
