Rajah Buayan
Rajah Buayan, officially the Municipality of Rajah Buayan (Maguindanaon: Ingud nu Rajah Buayan; Iranun: Inged a Rajah Buayan; Tagalog: Bayan ng Rajah Buayan), is a — municipality in the province of Maguindanao, Philippines. According to the 2015 census, it has a population of 23,652 people. [3]
Rajah Buayan | |
|---|---|
| Municipality of Rajah Buayan | |
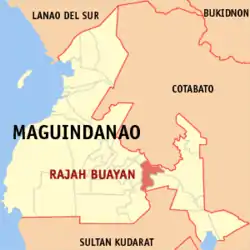 Map of Maguindanao with Rajah Buayan highlighted | |
OpenStreetMap 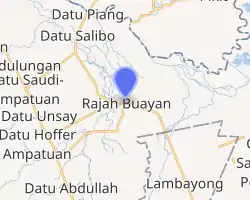
| |
.svg.png.webp) Rajah Buayan Location within the Philippines | |
| Coordinates: 6°54′39″N 124°33′03″E | |
| Country | |
| Region | Bangsamoro Autonomous Region in Muslim Mindanao (BARMM) |
| Province | Maguindanao |
| District | 2nd District |
| Founded | September 4, 2004 |
| Barangays | 15 (see Barangays) |
| Government | |
| • Type | Sangguniang Bayan |
| • Mayor | Yacob L. Ampatuan |
| • Vice Mayor | Jinn U. Lumenda |
| • Representative | Esmael G. Mangudadatu |
| • Electorate | 10,807 voters (2019) |
| Area | |
| • Total | 71.98 km2 (27.79 sq mi) |
| Elevation | 15 m (49 ft) |
| Highest elevation | 76 m (249 ft) |
| Lowest elevation | 5 m (16 ft) |
| Population | |
| • Total | 23,652 |
| • Density | 330/km2 (850/sq mi) |
| • Households | 3,768 |
| Economy | |
| • Income class | no value |
| • Poverty incidence | 55.35% (2015)[4] |
| • Revenue | ₱55,887,205.54 (2016) |
| Service provider | |
| • Electricity | Maguindanao Electric Cooperative |
| Time zone | UTC+8 (PST) |
| ZIP code | 9611 |
| PSGC | |
| IDD : area code | +63 (0)64 |
| Climate type | tropical climate |
| Native languages | Maguindanao Tagalog |
The municipality was created under Muslim Mindanao Autonomy Act No. 166 dated October 28, 2002 and was ratified through plebiscite on September 4, 2004.[5][6] It was carved out of the town of Sultan sa Barongis.
Geography
Barangays
Rajah Buayan is politically subdivided into 11 barangays.
- Baital
- Bakat
- Dapantis
- Gaunan
- Malibpolok
- Mileb
- Panadtaban
- Pidsandawan
- Sampao
- Tabungao
- Zapakan (Poblacion)
Climate
| Climate data for Rajah Buayan, Maguindanao | |||||||||||||
|---|---|---|---|---|---|---|---|---|---|---|---|---|---|
| Month | Jan | Feb | Mar | Apr | May | Jun | Jul | Aug | Sep | Oct | Nov | Dec | Year |
| Average high °C (°F) | 32 (90) |
32 (90) |
33 (91) |
33 (91) |
32 (90) |
31 (88) |
30 (86) |
31 (88) |
31 (88) |
31 (88) |
31 (88) |
31 (88) |
32 (89) |
| Average low °C (°F) | 21 (70) |
21 (70) |
21 (70) |
22 (72) |
23 (73) |
23 (73) |
23 (73) |
23 (73) |
23 (73) |
23 (73) |
23 (73) |
22 (72) |
22 (72) |
| Average precipitation mm (inches) | 19 (0.7) |
14 (0.6) |
15 (0.6) |
18 (0.7) |
33 (1.3) |
42 (1.7) |
44 (1.7) |
42 (1.7) |
30 (1.2) |
31 (1.2) |
28 (1.1) |
17 (0.7) |
333 (13.2) |
| Average rainy days | 6.9 | 5.6 | 6.9 | 8.1 | 15.1 | 17.5 | 17.8 | 18.5 | 14.9 | 14.9 | 12.4 | 8.0 | 146.6 |
| Source: Meteoblue (modeled/calculated data, not measured locally)[7] | |||||||||||||
Demographics
| Year | Pop. | ±% p.a. |
|---|---|---|
| 2007 | 24,973 | — |
| 2010 | 17,423 | −12.28% |
| 2015 | 23,652 | +5.99% |
| Source: Philippine Statistics Authority [3] [8] [9][10] | ||
References
- Municipality of Rajah Buayan | (DILG)
- "Province: Maguindanao". PSGC Interactive. Quezon City, Philippines: Philippine Statistics Authority. Retrieved 12 November 2016.
- Census of Population (2015). "ARMM – Autonomous Region in Muslim Mindanao". Total Population by Province, City, Municipality and Barangay. PSA. Retrieved 20 June 2016.
- https://psa.gov.ph/sites/default/files/City%20and%20Municipal-level%20Small%20Area%20Poverty%20Estimates_%202009%2C%202012%20and%202015_0.xlsx; publication date: 10 July 2019; publisher: Philippine Statistics Authority.
- "Muslim Mindanao Autonomy Act No. 166; An Act Creating the Municipality of Rajah Buayan in the Province of Maguindanao, Appropriating Funds Therefor, and for Other Purposes" (PDF). Regional Legislative Assembly, Autonomous Region in Muslim Mindanao. Retrieved 27 January 2016.
- National Statistical Coordination Board (2004-10-25). "2004 Factsheet (August 1-September 30, 2004)". Archived from the original on September 16, 2006. Retrieved 2006-06-24.
- "Rajah Buayan, Maguindanao : Average Temperatures and Rainfall". Meteoblue. Retrieved 19 January 2019.
- Census of Population and Housing (2010). "ARMM – Autonomous Region in Muslim Mindanao". Total Population by Province, City, Municipality and Barangay. NSO. Retrieved 29 June 2016.
- Censuses of Population (1903–2007). "ARMM – Autonomous Region in Muslim Mindanao". Table 1. Population Enumerated in Various Censuses by Province/Highly Urbanized City: 1903 to 2007. NSO.
- "Province of Maguindanao". Municipality Population Data. Local Water Utilities Administration Research Division. Retrieved 17 December 2016.
- "Poverty incidence (PI):". Philippine Statistics Authority. Retrieved 28 December 2020.
- https://psa.gov.ph/sites/default/files/2006%20and%202009%20City%20and%20Municipal%20Level%20Poverty%20Estimates_0_1.pdf; publication date: 3 August 2012; publisher: Philippine Statistics Authority.
- https://psa.gov.ph/sites/default/files/2012%20Municipal%20and%20City%20Level%20Poverty%20Estima7tes%20Publication%20%281%29.pdf; publication date: 31 May 2016; publisher: Philippine Statistics Authority.
- https://psa.gov.ph/sites/default/files/City%20and%20Municipal-level%20Small%20Area%20Poverty%20Estimates_%202009%2C%202012%20and%202015_0.xlsx; publication date: 10 July 2019; publisher: Philippine Statistics Authority.
External links
- Rajah Buayan Profile at PhilAtlas.com
- Philippine Standard Geographic Code
- Philippine Census Information
- Local Governance Performance Management System
Places adjacent to Rajah Buayan | |
|---|---|
Buluan (capital) | |
| Municipalities |
|
| Independent component city |
|
This article is issued from Wikipedia. The text is licensed under Creative Commons - Attribution - Sharealike. Additional terms may apply for the media files.
