South Upi
South Upi, officially the Municipality of South Upi (Maguindanaon: Ingud nu South Upi; Iranun: Inged a South Upi; Tagalog: Bayan ng South Upi), is a 4th class municipality in the province of Maguindanao, Philippines. According to the 2015 census, it has a population of 40,178 people. [3]
South Upi | |
|---|---|
| Municipality of South Upi | |
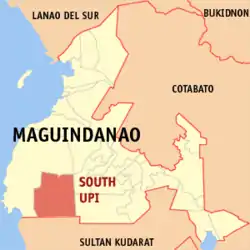 Map of Maguindanao with South Upi highlighted | |
OpenStreetMap 
| |
.svg.png.webp) South Upi Location within the Philippines | |
| Coordinates: 6°51′17″N 124°08′39″E | |
| Country | |
| Region | Bangsamoro Autonomous Region in Muslim Mindanao (BARMM) |
| Province | Maguindanao |
| District | 1st District |
| Founded | June 11, 1978 |
| Barangays | 11 (see Barangays) |
| Government | |
| • Type | Sangguniang Bayan |
| • Mayor | Reynalbert O. Insular |
| • Vice Mayor | Imelda B. Estorninos |
| • Representative | Esmael G. Mangudadatu |
| • Electorate | 25,971 voters (2019) |
| Area | |
| • Total | 184.80 km2 (71.35 sq mi) |
| Elevation | 639 m (2,096 ft) |
| Highest elevation | 1,083 m (3,553 ft) |
| Lowest elevation | 247 m (810 ft) |
| Population | |
| • Total | 40,178 |
| • Density | 220/km2 (560/sq mi) |
| • Households | 7,418 |
| Economy | |
| • Income class | 4th municipal income class |
| • Poverty incidence | 48.47% (2015)[4] |
| • Revenue | ₱88,848,638.77 (2016) |
| Service provider | |
| • Electricity | Maguindanao Electric Cooperative |
| Time zone | UTC+8 (PST) |
| ZIP code | 9603 |
| PSGC | |
| IDD : area code | +63 (0)64 |
| Climate type | tropical climate |
| Native languages | Maguindanao Tiruray Tagalog |
| Website | www |
South Upi was created through Presidential Decree No. 1580 by then President Ferdinand Marcos[5] on June 11, 1978. It was carved from the municipality of Upi.
It also known as Timanan.
Geography
Barangays
South Upi is politically subdivided into 11 barangays.
- Kuya
- Biarong
- Bongo
- Itaw
- Kigan
- Lamud
- Looy/Santa Fe
- Pandan
- Pilar
- Romangaob (Poblacion)
- San Jose
Climate
| Climate data for South Upi, Maguindanao | |||||||||||||
|---|---|---|---|---|---|---|---|---|---|---|---|---|---|
| Month | Jan | Feb | Mar | Apr | May | Jun | Jul | Aug | Sep | Oct | Nov | Dec | Year |
| Average high °C (°F) | 31 (88) |
32 (90) |
32 (90) |
32 (90) |
31 (88) |
29 (84) |
29 (84) |
29 (84) |
30 (86) |
30 (86) |
30 (86) |
31 (88) |
31 (87) |
| Average low °C (°F) | 21 (70) |
21 (70) |
21 (70) |
23 (73) |
23 (73) |
23 (73) |
23 (73) |
23 (73) |
23 (73) |
23 (73) |
23 (73) |
22 (72) |
22 (72) |
| Average precipitation mm (inches) | 30 (1.2) |
19 (0.7) |
25 (1.0) |
24 (0.9) |
64 (2.5) |
88 (3.5) |
102 (4.0) |
105 (4.1) |
76 (3.0) |
82 (3.2) |
60 (2.4) |
26 (1.0) |
701 (27.5) |
| Average rainy days | 9.8 | 8.5 | 11.3 | 11.9 | 21.6 | 23.9 | 24.1 | 24.5 | 20.9 | 21.8 | 16.8 | 11.8 | 206.9 |
| Source: Meteoblue (modeled/calculated data, not measured locally)[6] | |||||||||||||
Demographics
| Year | Pop. | ±% p.a. |
|---|---|---|
| 1980 | 11,463 | — |
| 1990 | 20,293 | +5.88% |
| 1995 | 23,186 | +2.53% |
| 2000 | 28,186 | +4.28% |
| 2007 | 32,014 | +1.77% |
| 2010 | 35,990 | +4.35% |
| 2015 | 40,178 | +2.12% |
| Source: Philippine Statistics Authority [3] [7] [8][9] | ||
References
- Municipality of South Upi | (DILG)
- "Province: Maguindanao". PSGC Interactive. Quezon City, Philippines: Philippine Statistics Authority. Retrieved 12 November 2016.
- Census of Population (2015). "ARMM – Autonomous Region in Muslim Mindanao". Total Population by Province, City, Municipality and Barangay. PSA. Retrieved 20 June 2016.
- https://psa.gov.ph/sites/default/files/City%20and%20Municipal-level%20Small%20Area%20Poverty%20Estimates_%202009%2C%202012%20and%202015_0.xlsx; publication date: 10 July 2019; publisher: Philippine Statistics Authority.
- https://www.officialgazette.gov.ph/1978/06/11/presidential-decree-no-1580-s-1978/
- "South Upi, Maguindanao : Average Temperatures and Rainfall". Meteoblue. Retrieved 19 January 2019.
- Census of Population and Housing (2010). "ARMM – Autonomous Region in Muslim Mindanao". Total Population by Province, City, Municipality and Barangay. NSO. Retrieved 29 June 2016.
- Censuses of Population (1903–2007). "ARMM – Autonomous Region in Muslim Mindanao". Table 1. Population Enumerated in Various Censuses by Province/Highly Urbanized City: 1903 to 2007. NSO.
- "Province of Maguindanao". Municipality Population Data. Local Water Utilities Administration Research Division. Retrieved 17 December 2016.
- "Poverty incidence (PI):". Philippine Statistics Authority. Retrieved 28 December 2020.
- https://psa.gov.ph/sites/default/files/2003%20SAE%20of%20poverty%20%28Full%20Report%29_1.pdf; publication date: 23 March 2009; publisher: Philippine Statistics Authority.
- https://psa.gov.ph/sites/default/files/2006%20and%202009%20City%20and%20Municipal%20Level%20Poverty%20Estimates_0_1.pdf; publication date: 3 August 2012; publisher: Philippine Statistics Authority.
- https://psa.gov.ph/sites/default/files/2012%20Municipal%20and%20City%20Level%20Poverty%20Estima7tes%20Publication%20%281%29.pdf; publication date: 31 May 2016; publisher: Philippine Statistics Authority.
- https://psa.gov.ph/sites/default/files/City%20and%20Municipal-level%20Small%20Area%20Poverty%20Estimates_%202009%2C%202012%20and%202015_0.xlsx; publication date: 10 July 2019; publisher: Philippine Statistics Authority.
External links
- South Upi Profile at PhilAtlas.com
- Philippine Standard Geographic Code
- Philippine Census Information
- Local Governance Performance Management System
Places adjacent to South Upi | |
|---|---|
Buluan (capital) | |
| Municipalities |
|
| Independent component city |
|
This article is issued from Wikipedia. The text is licensed under Creative Commons - Attribution - Sharealike. Additional terms may apply for the media files.
