Child Development Index
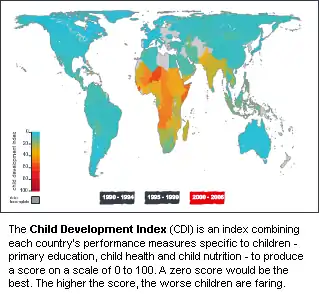
The Child Development Index (CDI) is an index combining performance measures specific to children—education, health and nutrition—to produce a score on a scale of 0 to 100. A zero score would be the best. The higher the score, the worse children are faring.
The Child Development Index was developed by Save the Children UK in 2008 through the contributions of Terry McKinley, Director of the Centre for Development Policy and Research at the School of Oriental and African Studies (SOAS), University of London, with support from Katerina Kyrili.
The indicators which make up the index were chosen because they are easily available, commonly understood, and clearly indicative of child wellbeing. The three indicators are:
- Health: the under-five mortality rate (the probability of dying between birth and five years of age, expressed as a percentage on a scale of 0 to 340 deaths per 1,000 live births). This means that a zero score in this component equals an underfive mortality rate of 0 deaths per 1,000 live births, and a score of 100 equals our upper bound of 340 deaths per 1,000 live births. The upper bound is higher than any country has ever reached; Niger came the closest in the 1990s with 320 under-five deaths per 1,000 live births.
- Nutrition: the percentage of under fives who are moderately or severely underweight. The common definition of moderately or severely underweight, which we use here, is being below two standard deviations of the median weight for age of the reference population.
- Education: the percentage of primary school-age children who are not enrolled in school. For our measure of education deprivation, we use the opposite of the Net Primary Enrolment rate—i.e., 100—the NER. This gives us the percentage of primary school-age children who are not enrolled.
What does the Child Development Index tell us about how children are faring around the world? Are some countries making good progress in improving child well-being? Is it getting worse in other countries? The Child Development Index answers these questions. The index measures child well-being over three periods from 1990. Japan is in first place, scoring just 0.4. Niger in Africa is in 137th place, with the highest score, 58, in 2000–2006.
Overall, child well-being has improved by 34% since 1990, but progress is slow.
Analysis of results
Children are doing worse in Sub-Saharan Africa than any other region. Africa scores 35 in the Index, reflecting the high level of deprivation in primary schooling, child health and child nutrition. It is also making the slowest progress, improving child well-being by only 20% over 1990–2006.
However, progress has been very mixed; some countries in Africa have done incredibly well, while others did spectacularly badly. Countries like Malawi cut child deprivation in half, enrolling more than 90% of primary school children. But some of the poorest children in Africa live in countries suffering from conflict and poor governance; such as Zimbabwe and the Democratic Republic of Congo. Slow progress in reducing child mortality and malnutrition is a particular problem; one in six babies born in Africa will not live to see their fifth birthday. Rich and poor countries worldwide must urgently choose to tackle this problem.
East Asia has made considerable progress in child well-being in recent years, improving it by 45% over 1990–2006, reducing deprivation to a score of just 8.5; only one other developing region, Latin America, scores better. It has the best level of primary school enrolment and has managed to halve its child mortality rate over 1990–2006. Much of this progress is because of China's significant improvement, where almost two-thirds of the region's children live. China has made tremendous progress in increasing people's incomes; nonetheless 417,000 children under the age of 5 years still died in China in 2006 alone. Countries like Malaysia and Thailand did even better in all 3 of the areas the CDI measures. But, as in other regions of the world, government policy plays an important role in children's lives. For example, Myanmar saw almost no improvement at all. And in many countries, the poorest, most isolated groups are being left behind.
South Asia has a high level of deprivation, scoring 26.4; this is 3 times worse than East Asia. It is also making slow progress, improving child well-being by just 32% over 1990–2006 (compared to East Asia's 45% improvement). This is because India (where almost three-quarters of the region's children live) made the least progress of any country in South Asia; just a 27% improvement. In this region, child nutrition is a substantial obstacle; almost 1 in 2 children is underweight. The region's enrolment indicator improved by 59% while its nutrition indicator improved by only 14%. Higher levels of economic growth in the region are not widely translating into reduced child deprivation.[1]
The Latin America and the Caribbean region made substantial progress in improving child well-being in the 1990s, scoring 6.8 in our index of child deprivation, the lowest of any developing country region. It made the most percentage improvement of any region in the world, reducing child deprivation by 57% over the period, 1990-2006. This improvement was largely driven by reductions in child mortality and increases in primary school enrolment. The region's child mortality rate is now the lowest of any developing region. The region's poorer countries, like Peru and El Salvador, have started to catch-up with the levels of child well-being seen in better-off countries in the region.
The Middle East and North Africa region scores 11.2 in our index, worse than East Asia but only a third as bad as Sub-Saharan Africa, and has reduced its level of child deprivation by 41% over 1990–2006. However, there is considerable variation within the region. Yemen is doing poorly, with a large increase in malnutrition over the period. And in several countries, such as Djibouti and Jordan, progress has stalled in some areas. In addition, the region includes Iraq, Lebanon, and the occupied Palestinian territory where child deprivation has increased. In contrast, several large countries such as Morocco, Egypt and Algeria have made substantial improvements. Again, little improvement has been made in reducing child malnutrition in the region as a whole.
The region containing Central and Eastern Europe and the Commonwealth of Independent States, for which data are much sparser in the early 1990s, saw an improvement of almost 15% in its index score between 1995–1999 and 2000–2006. Its score stands at 9.2, slightly worse than East Asia and slightly better than the Middle East and North Africa. Turkey, with a large child population, made the most progress in the region, reducing its score from 20 in the early 1990s to 7 for 2000–2006.
The Child Development Index shows that there is a low level of deprivation in developed countries in the three basic areas of child rights that it measures. On a scale of 0–100, these countries score 2.1, the lowest regional Index score worldwide. There is still some variation between these countries however; for example the United States has a child mortality rate that is twice of Japan's and worse even than that of Cuba's.
2008 CDI Report
The report was launched in London on 10 December 2008. Its focus was on "Holding governments to account for children's wellbeing". The paper was written by Sarah Hague at Save the Children UK, with support from Sophie Elmhirst and David Mepham.
In headline terms, the report shows that:
- there are still high levels of child poverty and deprivation in many countries (albeit often hidden from the public spotlight)
- income levels are a poor indicator of progress in reducing child deprivation
- children's wellbeing does not necessarily improve in line with adult wellbeing
- there is considerable variation – between countries, globally and within regions – in terms of the rights, opportunities and wellbeing that children enjoy, with the obvious implication that national political and policy choices matter enormously for children's wellbeing.
Criticisms
In a note on the index,[2] Achim Wolf, a student at the University of York, observed that the CDI is obtained by averaging the three variables on health, education and nutrition. This method of aggregation "presupposes that these variables can be compared with one another", which is however not the case. Indeed, the three units are on different scales and have different ranges, making this method hard to justify in this case. He goes on to offer an alternative index using more established methods and finds that while, in general, the results do not vary considerably, some countries shift by up to 18 places in the ranking. The paper was mentioned in the International Society for Child Indicators' Newsletter of May 2009.
Notes
- "Indian baby Weight and Height Chart". superbabyonline. Retrieved 14 Apr 2016.
- Achim Wolf. "Note on the Save the Children CDI" (PDF). University of York. Retrieved 2010-01-20.
