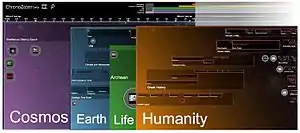
ChronoZoom
ChronoZoom is a free open source project that visualizes time on the broadest possible scale from the Big Bang to the present day.[1] Conceived by Walter Alvarez and Roland Saekow and developed by the department of Earth and Planetary Science at the University of California, Berkeley in collaboration with Microsoft Research and Moscow State University, Alvarez unveiled the first ChronoZoom prototype at UC Berkeley's 2010 Faculty Research Lecture.[2] Although that demo is no longer available to the public online,[3] a second version rewritten in HTML5 is now available and open source.[4] ChronoZoom was inspired by the study of Big History, and it approaches the documentation and visualization of time and history in the same way that Google Earth deals with geography.[5] ChronoZoom allows users to see the true scale of time over cosmic, geologic, biological and social periods.[6]
 ChronoZoom is a free open source project that seeks to visualize time at all scales from the big bang 13.8 billion years ago to billions of years in the future. | |
| Developer(s) | University of California Berkeley, Moscow State University, Microsoft Research |
|---|---|
| Initial release | April 29, 2010 |
| Repository | github |
| Written in | JavaScript, HTML5, C# |
| Type | Website |
| License | Apache License 2.0 |
| Website | www |
Purpose
The primary goal of ChronoZoom is to make time relationships between different studies of history clear and vivid. In the process, it provides a framework for exploring related electronic resources. It thus serves as a "master timeline" tying together all kinds of specialized timelines and electronic resources, and aspires to bridge the gap between the humanities and the sciences and to bring together and unify all knowledge of the past.[7] ChronoZoom is planned as an educational tool as well as a research tool, by allowing researchers to plot various time series data next to each other for comparison.
Versions
The 1.0 proof of concept was released on April 29, 2010 at the 97th Annual Faculty Research Lecture Series given by Alvarez.[8]
A 2.0 beta was released on March 14, 2012, completely rewritten in HTML5 and an available open source[9] via the Outercurve Foundation.[10]
Work continued through 2014 supported by Microsoft Research (Redmond). The work continues as of 2015 supported by Axiell (Sweden), Fontys University (Eindhoven), and the University of Amsterdam.[11] The project code is freely accessible on GitHub.[12]
Awards
- 2013 SXSW Interactive Awards Winner (Educational Resource)
- 2012 Digital Education Achievement Award Winner (University Project)
References
- Blowing Your Mind with Chronozoom (or how we can wrap our minds around ‘Big History’)
- "History of Faculty Research Lectures at UC Berkeley". Archived from the original on 2012-03-17. Retrieved 2011-12-21.
- ChronoZoom 1.0 (Silverlight version) is no longer available
- UC Berkeley ChronoZoom 2.0 Beta Press Release
- ChronoZoom is the coolest thing since GoogleEarth.
- State Geologist of Arizona Discusses ChronoZoom
- Microsoft Research Project Page
- UC Berkeley 97th Annual Faculty Research Lecture Series Video
- UC Berkeley ChronoZoom 2.0 Beta Press Release
- "ChronoZoom Outercurve Foundation page". Archived from the original on 2014-02-15. Retrieved 2011-12-21.
- Axiell to bring ChronoZoom history visualization project to next level
- ChronoZoom on Github
