Timeline
A timeline is a display of a list of events in chronological order.[1] It is typically a graphic design showing a long bar labelled with dates paralleling it, and usually contemporaneous events; a Gantt chart is a form of timeline used in project management.
Timelines can use any suitable scale representing time, suiting the subject and data; many use a linear scale, in which a unit of distance is equal to a set amount of time. This timescale is dependent on the events in the timeline. A timeline of evolution can be over millions of years, whereas a timeline for the day of the September 11 attacks can take place over minutes, and that of an explosion over milliseconds.[2] While many timelines use a linear timescale—especially where very large or small timespans are relevant -- logarithmic timelines entail a logarithmic scale of time; some "hurry up and wait" chronologies are depicted with zoom lens metaphors.
Types
There are different types of timelines
- Text timelines, labeled as text
- Number timelines, the labels are numbers, commonly line graphs
- Interactive, clickable, zoomable
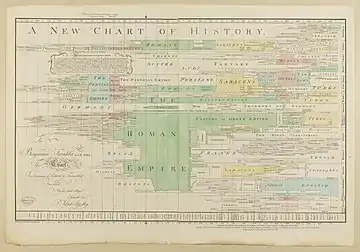
There are many methods of visualizations for timelines. Historically, timelines were static images and generally drawn or printed on paper. Timelines relied heavily on graphic design, and the ability of the artist to visualize the data.
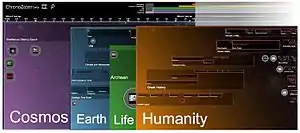
Timelines, no longer constrained by previous space and functional limitations, are now digital and interactive, generally created with computer software. ChronoZoom is an example of computer-aided interactive timeline software.
Uses of timelines
Timelines are often used in education to help students and researchers with understanding the order or chronology of historical events and trends for a subject. When showing time on a specific scale on an axis, a timeline can be used to visualize time lapses between events, durations (such as lifetimes or wars), and the simultaneity or overlap of spans and events.
In historical studies
Timelines are particularly useful for studying history, as they convey a sense of change over time. Wars and social movements are often shown as timelines. Timelines are also useful for biographies. Examples include:
In natural sciences
Timelines are also used in the natural world and sciences, for subjects such as astronomy, biology, and geology:
- 2009 flu pandemic timeline
- Chronology of the universe
- Geologic time scale
- Timeline of evolutionary history of life
In project management
Another type of timeline is used for project management. In these cases, timelines are used to help team members to know what milestones need to be achieved and under what time schedule. For example, in the case of establishing a project timeline in the implementation phase of the life cycle of a computer system.
See also
|
|
References
- Grafton, Anthony; Rosenberg, Daniel (2010), Cartographies of Time: A History of the Timeline, Princeton Architectural Press, p. 272, ISBN 978-1-56898-763-7
- plarson (September 1, 2016). "Anomaly Updates". SpaceX. Retrieved July 16, 2017.
External links
| Wikimedia Commons has media related to Timeline. |
| Look up timeline in Wiktionary, the free dictionary. |
- "British Library interactive timeline". bl.uk/timeline.
- "Port Royal des Champs museum timeline". port-royal-des-champs.eu/frise.
| Key concepts |  | ||||||
|---|---|---|---|---|---|---|---|
| Measurement and standards |
| ||||||
| Clocks | |||||||
| |||||||
| |||||||
| Philosophy of time | |||||||
| Human experience and use of time |
| ||||||
| Time in |
| ||||||
| Related topics | |||||||
| |||||||
