ProcDump
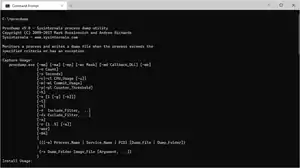
ProcDump is a command-line application used for monitoring an application for CPU spikes and creating crash dumps during a spike.[2][3] The crash dumps can then be used by an administrator or software developer to determine the cause of the spike. ProcDump supports monitoring of hung windows and unhandled exceptions. It can also create dumps based on the values of system performance counters.
 ProcDump v9.0 | |
| Original author(s) | Winternals Software |
|---|---|
| Developer(s) | Microsoft |
| Stable release | v9.0 (Windows version) v1.1.1 (Linux version)[1] / May 16, 2017 (Windows version) April 3, 2020 (Linux version) |
| Repository | github |
| Written in | C |
| Operating system | Microsoft Windows, Linux |
| Available in | English |
| License | Windows: Proprietary commercial software Linux: MIT License |
| Website | docs |
Overview
Initially, ProcDump was only available for Microsoft Windows. In November 2018, Microsoft confirmed it is porting Sysinternals tools, including ProcDump and ProcMon, to Linux.[4] The software is open source. It is licensed under MIT License and the source code is available on GitHub.[5]
The Linux version requires Linux kernels version 3.5+ and runs on Red Hat Enterprise Linux / CentOS 7, Fedora 26, Mageia 6, Ubuntu 14.04 LTS. It currently does not have full feature parity with the Windows version (e.g. custom performance counters).
Example
Create 5 core dumps 10 seconds apart of the target process with process identifier (pid) == 1234
$ sudo procdump -n 5 -p 1234
References
- "microsoft/ProcDump-for-Linux". GitHub.
- "ProcDump - Monitor CPU/processes - Windows CMD - SS64.com". ss64.com.
- "How to collect memory dumps using ProcDump - Sitecore Knowledge Base". kb.sitecore.net.
- Cimpanu, Catalin (5 November 2018). "Microsoft working on porting Sysinternals to Linux". ZDNet. CBS Interactive. Retrieved 5 November 2018.
- "microsoft/ProcDump-for-Linux". November 6, 2020 – via GitHub.
