City of Johannesburg Metropolitan Municipality
The City of Johannesburg Metropolitan Municipality is a metropolitan municipality that manages the local governance of Johannesburg, South Africa. It is divided into several branches and departments in order to expedite services for the city.
City of Johannesburg | |
|---|---|
 Seal | |
.svg.png.webp) Location in Gauteng | |
| Coordinates: 26°10′S 28°0′E | |
| Country | South Africa |
| Province | Gauteng |
| Seat | Johannesburg |
| Wards | 130 |
| Government | |
| • Type | Municipal council |
| • Mayor | Geoff Makhubo (ANC) |
| Area | |
| • Total | 1,645 km2 (635 sq mi) |
| Population (2011)[2] | |
| • Total | 4,434,827 |
| • Density | 2,700/km2 (7,000/sq mi) |
| Racial makeup (2011) | |
| • Black African | 76.4% |
| • Coloured | 5.6% |
| • Indian/Asian | 4.9% |
| • White | 12.3% |
| First languages (2011) | |
| • Zulu | 23.4% |
| • English | 20.1% |
| • Sotho | 9.6% |
| • Tswana | 7.7% |
| • Other | 39.2% |
| Time zone | UTC+2 (SAST) |
| Municipal code | JHB |
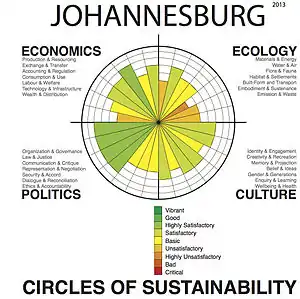
Johannesburg is a divided city: the poor mostly live in the southern suburbs or on the peripheries of the far north, and the middle class live largely in the suburbs of the central and north. As of 2012, unemployment is near 25% and most young people are out of work.[3] Around 20% of the city lives in abject poverty in informal settlements that lack proper roads, electricity, or any other kind of direct municipal service. Another 40% live in inadequate housing with insufficient municipal housing.
History
Following the end of the apartheid era, in April 1991 the Central Witwatersrand Metropolitan Chamber was formed as a "people-based" negotiating forum prior to holding a democratic election and the formation of a new administration for the Johannesburg area. Following the 1993 "Local Government Transition Act", the Greater Johannesburg Negotiating Forum was created, and this forum in September 1994 reached an agreement which entailed regrouping the suburbs into new municipal structures, the metropolitan local councils (MLCs), and the overarching Greater Johannesburg Metropolitan Council,[4] also known as the "Transitional Metropolitan Council" for the city.[5]
The government of Johannesburg's metropolitan area evolved over a seven-year period from 1993, when no metropolitan government existed under apartheid, to the establishment in December 2000 of today's Metropolitan Municipality. An "interim phase" commenced with the 1993 Constitution. This saw the establishment at the metropolitan level of the Transitional Metropolitan Council (TMC) and several urban-level councils under and neighbouring the TMC. In February 1997 the final constitution replaced the interim constitution and its transitional councils with the final system of local government which defined the current category A, B and C municipalities. Today's City of Johannesburg Metropolitan Municipality was created accordingly as a category A municipality, giving it exclusive executive and legislative power over its area.[6]
1995 and the Greater Johannesburg Metropolitan Council
The new post-apartheid administration was the "Greater Johannesburg Metropolitan Council" (GJMC), also known as the "Transitional Metropolitan Council", created in 1995.[7] The council adopted the slogan "One City, One Taxpayer" to highlight its primary goal of addressing unequal tax revenue distribution. To this end, revenue from wealthy, traditionally white areas would pay for services needed in poorer, black areas. The City Council was divided initially into seven municipal substructures (MSSs), rationalized within a year to four MSSs, each with a substantially autonomous authority or "Metropolitan Local Council" (MLC) that was to be overseen by the central metropolitan council. Furthermore, the municipal boundaries were expanded to include wealthy satellite towns like Sandton and Randburg, poorer neighbouring townships such as Soweto and Alexandra, and informal settlements like Orange Farm.[7] The four MLCs were: the Southern MLC covering Ennerdale, most of Soweto, parts of Diepmeadow and the old Johannesburg City and Lenasia; the Northern MLC covering Randburg and Randburg CBD, and parts of Soweto, Diepmeadow and the old Johannesburg City; the Eastern MLC covering Sandton, Alexandra, and part of the old Johannesburg City; the Western MLC covering Roodepoort, Dobsonville and parts of Soweto, Diepmeadow.[8]
However, the new post-apartheid City Council ran into problems in part due to inexperienced management and political pressure, which contributed to over-ambitious revenue projections, over-spending, wasted expenditures and out-right fraud.[5] In the newly combined metropole services were unnecessarily duplicated. But, by far, the biggest financial drain was the failure to collect revenues for services, which ranged from rent (rates) to utilities. Part of this failure was a result of the anti-apartheid boycott of paying the government.[9][7]
In 1999, Johannesburg appointed a city manager to reshape the city's ailing financial situation.[9][10] The manager, together with the Municipal Council, drew up a blueprint called "iGoli 2002". This was a restructuring plan to be completed in 2002, that called upon the government to sell non-core assets, restructure certain utilities, and required that all others become self-sufficient. The plan was strongly opposed by unions who feared a loss of jobs.
2000 and the new Metropolitan Municipality

In 1999 the Municipal Demarcation Board conducted a study of metropolitan areas and other large councils, and found that Johannesburg should be declared as a "category A" municipality.[11] The following Local Government Municipal Systems Act no. 32 of 2000 replaced the GJMC, its four MLCs and also the neighbouring Midrand Local Authority, with the new "City of Johannesburg Metropolitan Municipality" from 6 December 2000.[12][13] The iGoli 2002 plan went into effect and returned some sectors into "cash cows" that helped support the city in general.[14] Although some jobs were lost, there were no mass firings, as agencies used attrition to remove excess staff.[15] The plan took the city from near insolvency[10] to an operating surplus of R 153 million (US$23.6 million).[9]
Following the relative success of iGoli 2002, the city undertook a number of initiatives both to help equalise municipal services benefits, such as the water utility's Free Basic Water policy, and to curb fraud and increase payment percentages, such as the water utility's Operation Gcin'amanzi to repipe areas to eliminate siphonage and to install water meters for excess use.[16]
For the first six years the city was administered in eleven numbered regions, which were: "Region 1": Diepsloot, Kya Sand; "Region 2": Midrand, Ivory Park; "Region 3": Sandton, Rosebank, Fourways, Sunninghill, Woodmead, Strijdom Park; "Region 4": Northcliff, Rosebank, Parktown; "Region 5": Roodepoort, Northgate, Constantia Kloof; "Region 6": Doornkop, Soweto, Dobsonville, Protea Glen; "Region 7": Alexandra, Wynberg, Bruma; "Region 8": Inner City (Johannesburg CBD); "Region 9": Johannesburg South, South Gate, Aeroton, City Deep; "Region 10": Diepkloof, Meadowlands; "Region 11": Ennerdale, Orange Farm, Lenasia.[17]
2006 reorganization
The present day City of Johannesburg was created from eleven existing local authorities, seven of which were white and four black or coloured. The white authorities were 90% self-sufficient from property tax and other local taxes, and produced and spent R 600 (US$93) per person in municipal services, while the black authorities were only 10% self-sufficient, spending R 100 (US$15) per person in municipal services.[9] Although Johannesburg was divided into eleven administrative regions, these new divisions did not correspond to the areas governed by the former local authorities.[7] Later, in 2006, the number of administrative regions was consolidated, from eleven to seven (see § Regions). The reason given was to separate powers between the legislative and executive bodies of the City.[18]
Nonetheless, according to the opposition party, fraud, theft and non-payment still remained problems as of 2013.[19] In fiscal year 2011, the city's audit had R 45,796 million chalked up to fraudulent activities.[20] In 2013, the city admitted that it would be unable to collect two-thirds of the R 18 billion in outstanding billings.[21]
The first undertaking of the newly created City of Johannesburg Metropolitan Municipality, as mapped out by the "Igoli 2002" plan, was to restructure Metro Gas, Rand Airport, and some sports stadiums as stand-alone corporate entitites. The city bus service, the Johannesburg Zoo, the Civic Theatre, the Fresh Produce Market, and the city's property holdings were turned into corporations with the city as the single shareholder. Each was run as a business, with management hired on performance contracts.
In 2010/11 the municipality faced a qualified audit from the Auditor-General following a large number of billing issues, as the result of the flawed implementation of a SAP system.[22][3] The city's call centre also experienced a crisis at the same time, with staff refusing to work.[23][24]
Geography
The municipality covers an area of 1,645 square kilometres (635 sq mi), stretching from Orange Farm in the south to Midrand in the north, and contains two big urban centres, Johannesburg and Midrand, and eleven more smaller urban centres, namely Roodepoort, Diepsloot, Killarney, Melrose Arch, Randburg, Rosebank, Sandton, Soweto, and Sunninghill.[11]:62,24
Main places
The 2011 census divided the municipality into the following main places (unchanged from the 2001 census):[25]
| Place | Code | Population | Area (km2) | Most spoken languages |
|---|---|---|---|---|
| Alexandra | 798014 | 179,624 | 6.91 | Zulu 26%, Pedi 23%, Tsonga 11%, Xhosa 9%, Tswana 9%, Sotho 7%, Venda 4% |
| Chartwell | 798011 | 1,728 | 9.07 | English 50%, Afrikaans 10%, Zulu 9%, foreign languages 7%, Ndebele 7% |
| City of Johannesburg (non-urban) | 798002 | 9,933 | 289.84 | English 15%, Zulu 14%, Sotho 12%, Afrikaans 11%, Tswana 10%, Xhosa 8%, Pedi 8%, foreign languages 5%, Tsonga 4%, Venda 4% |
| Dainfern | 798012 | 6,601 | 4.08 | English 65%, foreign languages 15%, Afrikaans 4%, Zulu 4% |
| Diepsloot | 798003 | 138,329 | 12.00 | Pedi 22%, Zulu 19%, Tsonga 10%, Ndebele 10%, Venda 9%, Tswana 7%, Xhosa 5%, foreign languages 4%, Sotho 4% |
| Drie Ziek | 798035 | 35,622 | 7.53 | Zulu 42%, Sotho 28%, Xhosa 8%, Tsonga 7% |
| Ebony Park | 798007 | 22,309 | 1.63 | Pedi 29%, Zulu 23%, Tswana 7%, Tsonga 7%, Xhosa 6%, Sotho 6%, Ndebele 4%, English 4% |
| Ennerdale | 798033 | 71,815 | 21.33 | Afrikaans 19%, English 18%, Zulu 17%, Sotho 16%, Xhosa 8%, Tsonga 5%, Tswana 5% |
| Farmall | 798017 | 1,051 | 5.01 | English 47%, Afrikaans 12%, foreign languages 9%, Zulu 7%, Pedi 5%, Tswana 4%, Ndebele 4% |
| Itsoseng | 798021 | 5,243 | 0.58 | Pedi 22%, Venda 15%, Tswana 13%, Zulu 11%, Ndebele 7%, Sotho 7%, Tsonga 7%, English 4%, foreign languages 4%, Xhosa 4% |
| Ivory Park | 798006 | 184,383 | 9.21 | Pedi 23%, Tsonga 22%, Zulu 21%, Xhosa 7%, foreign languages 5%, Ndebele 5%, Sotho 4% |
| Johannesburg | 798015 | 957,441 | 334.81 | English 31%, Zulu 19%, Afrikaans 12%, foreign languages 7%, Xhosa 5%, Ndebele 4%, Sotho 4%, Pedi 4%, Tswana 4%, Tsonga 3%, Venda 1% |
| Kaalfontein | 798005 | 46,147 | 4.96 | Pedi 30%, Zulu 21%, Tsonga 10%, Xhosa 8%, foreign languages 5%, Sotho 5%, Ndebele 5%, Tswana 4% |
| Kagiso | 798024 | 5,182 | 0.57 | Tswana 33%, Zulu 17%, Xhosa 11%, Sotho 9%, Tsonga 8%, Venda 5%, Pedi 4% |
| Kanana Park | 798039 | 21,005 | 6.82 | Zulu 35%, Xhosa 22%, Sotho 20%, Tsonga 5% |
| Lakeside | 798037 | 23,503 | 3.78 | Sotho 48%, Zulu 30%, Xhosa 8% |
| Lanseria | 798019 | 4,788 | 1.83 | Pedi 19%, Tswana 15%, Zulu 15%, Tsonga 10%, Venda 8%, English 7%, Sotho 6%, Xhosa 6%, Ndebele 5% |
| Lawley | 798038 | 33,136 | 6.09 | Zulu 28%, Sotho 20%, Tsonga 13%, Xhosa 8%, English 5%, Tswana 5%, Pedi 4%, Venda 4%, Afrikaans 4% |
| Lehae | 798029 | 13,380 | 3.50 | Zulu 42%, Sotho 13%, Tsonga 12%, Xhosa 10%, Tswana 5% |
| Lenasia | 798028 | 89,714 | 20.28 | English 55%, Zulu 8%, Tswana 8%, Sotho 6%, Xhosa 4%, foreign languages 4%, Afrikaans 4% |
| Lenasia South | 798032 | 37,110 | 13.98 | English 53%, Zulu 12%, Sotho 8%, Xhosa 5%, Tswana 5% |
| Lucky 7 | 798020 | 0 | 0.11 | n. a. |
| Malatjie | 798001 | 2,321 | 0.18 | Pedi 23%, Tswana 13%, Zulu 12%, Venda 12%, Ndebele 9%, Tsonga 7%, Sotho 6%, foreign languages 5%, Xhosa 4% |
| Mayibuye | 798009 | 22,178 | 1.16 | Pedi 24%, Zulu 18%, Xhosa 15%, Tsonga 9%, Ndebele 9%, foreign languages 7%, Sotho 4% |
| Midrand | 798004 | 87,387 | 152.87 | English 50%, Zulu 10%, Afrikaans 6%, foreign languages 5%, Xhosa 5%, Tswana 5%, Pedi 4%, Sotho 4% |
| Millgate Farm | 798018 | 172 | 0.88 | n. a. |
| Orange Farm | 798034 | 76,767 | 12.16 | Zulu 44%, Sotho 29%, Xhosa 9%, Tsonga 4% |
| Poortjie | 798040 | 11,153 | 2.43 | Sotho 38%, Zulu 19%, Xhosa 18%, Tsonga 9%, Tswana 5% |
| Rabie Ridge | 798008 | 41,204 | 3.33 | Pedi 32%, Zulu 16%, Tsonga 9%, Afrikaans 8%, Xhosa 8%, Sotho 5%, Tswana 4%, Ndebele 4% |
| Randburg | 798016 | 337,053 | 167.98 | English 52%, Afrikaans 17%, Zulu 6%, foreign languages 5%, Tswana 4% |
| Randfontein | 798027 | 0 | 9.19 | n. a. |
| Rietfontein | 798023 | 196 | 2.17 | n. a. |
| Roodepoort | 798022 | 326,416 | 161.50 | English 29%, Afrikaans 23%, Zulu 9%, Tswana 8%, Pedi 4%, Xhosa 4%, Sotho 4%, foreign languages 3%, Venda 3% |
| Sandton | 798013 | 222,415 | 143.54 | English 63%, Afrikaans 7%, Zulu 6%, foreign languages 6% |
| Soweto | 798026 | 1,271,628 | 200.03 | Zulu 37%, Sotho 15%, Tswana 12%, Tsonga 8%, Pedi 5%, Venda 4%, English 2%, Ndebele 1%, Afrikaans 1%, foreign languages 1% |
| Stretford | 798036 | 61,141 | 7.38 | Zulu 39%, Sotho 34%, Xhosa 9%, Tsonga 4% |
| Tshepisong | 798025 | 53,260 | 6.56 | Zulu 26%, Tswana 22%, Xhosa 12%, Tsonga 12%, Sotho 9%, Pedi 5%, Venda 5% |
| Vlakfontein | 798031 | 27,291 | 4.63 | Zulu 38%, Sotho 17%, Tsonga 10%, Xhosa 9%, Tswana 6%, Pedi 4% |
| Zakariyya Park | 798030 | 6,200 | 1.96 | English 34%, Zulu 20%, Sotho 9%, Tswana 6%, Xhosa 6%, Tsonga 5%, foreign languages 4% |
| Zevenfontein | 798010 | 0 | 3.11 | n. a. |
Government
Each province determines the structure of local government in its region. Gauteng province, run by the African National Congress, has opted for a Mayor–council government. The first Mayor of Johannesburg was Amos Mosondo since the establishment of the current structure.
Regions
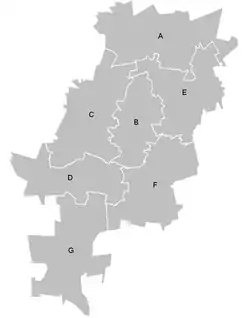
The administration of the City of Johannesburg Metropolitan Municipality was decentralised initially into eleven regions, named simply Region 1 to Region 11, which were largely unrelated to the 11 former apartheid administrations. The new numbered regions were subsequently consolidated, in the summer of 2006, to seven regions named Region A to Region G. The current regions are:[26][27]
- Region A - Diepsloot, Midrand and Ivory Park (previously Regions 1 and 2)
- Region B - Northcliff and parts of Sandton and Rosebank (previously Region 4 and parts of Region 3)
- Region C - Roodepoort (previously, Region 5)
- Region D - Soweto, Doornkop, Diepkloof and Meadowlands (previously Regions 6 and 10)
- Region E - Alexandra and parts of Sandton and Rosebank (previously Region 7 and parts of Region 3)
- Region F - inner city and Johannesburg South (previously Regions 8 and 9)
- Region G - Ennerdale, Orange Farm, Lenasia, Eldorado Park and Protea. (previously Region 11)
Each region is operationally responsible for the delivery of health care, housing, sports and recreation, libraries, social development, and other local community-based services, and each region has a People's Centre where any city-related transaction can be dealt with. Residents can lodge complaints, report service problems, and perform council-related business more quickly.
Changes to the previous city structure
After the end of apartheid allowed the consideration of the entire city of Johannesburg as one without consideration of race, it was determined that the previous structure of the city was wasteful and that there was much duplication of functions. Furthermore, some suburbs were affluent with well-established amenities while neighbouring areas lacked even the most basic of services. The new regions are presently smaller than previous mega-suburbs with each being home to about 300,000 people. The idea is that smaller regions are able to stay in closer contact with local communities.
Administration
The regions are no longer seen as part of the core administration, but instead take on a role as contractors to the central government. The relationship is similar to that of the larger utilities and agencies, such as City Power, and is designed to maximise efficiency.
The closeness of the new regional administrations with their communities enables them to be more responsive to differing local needs. For instance, the needs of a high-income commercial centre such as Sandton will be very different from the needs of a low-income area such as Orange Farm.
Local Integrated Development Plans
Local Integrated Development Plans (LIDPs) are plans for the development of a specific area. A LIDP guides a region's future development. For this reason, the LIDP zones closely follow the boundaries of the regions. However, in certain cases where suburbs are cut in half by the new region boundaries, the entire suburb may be covered in only one of the regions.
LIDPs deal with city development, management and growth over a five to 10-year period. While they deal with local issues, they take an integrated approach to issues such as transportation, housing and environmental management. An overall Metropolitan IDP looks at the bigger picture and ensures that LIDPs don't conflict or lead to wasted resources. LIDPs will be revised annually so as to respond to changing conditions both locally and at a city level.
City council
As of the August 2016 municipal elections, the municipal council consists of 270 City Councillors in Johannesburg elected by mixed-member proportional representation. The Councillors are divided into two kinds: (a) 135 Ward councillors who have been elected by first-past-the-post voting in 135 wards; and (b) 135 councillors elected from party lists (so that the total number of party representatives is proportional to the number of votes received).
Ward Councillors have more local responsibilities, including setting up Ward Committees in their wards to raise local issues, commenting on town planning and other local matters in their ward, and liaising with local ratepayers' and residents' associations. PR Councillors are usually allocated to more political tasks within their party structures and within the City.
2016 Election

In the election of 3 August 2016 the African National Congress (ANC) won the largest share of the seats on the council with 121 but did not achieve a majority. On 22 August 2016, minority parties voted with the DA to elect its mayoral candidate, Herman Mashaba, as the first Democratic Alliance mayor of Johannesburg.[28] Mashaba appointed a mayoral committee consisting of the DA and the Inkatha Freedom Party (IFP). Mashaba resigned on 27 November 2019. The ANC regional chair Geoff Makhubo was elected mayor on 4 December 2019, marking the return of the ANC to the city's executive since its ousting in 2016.[29]
The following table shows the results of the 2016 election.[30][31]
| Party | Votes | Seats | ||||||
|---|---|---|---|---|---|---|---|---|
| Ward | PR List | Total | % | Ward | PR | Total | ||
| ANC | 555,284 | 566,664 | 1,121,948 | 44.5 | 84 | 37 | 121 | |
| Democratic Alliance | 482,494 | 483,698 | 966,192 | 38.4 | 51 | 53 | 104 | |
| Economic Freedom Fighters | 141,395 | 137,800 | 279,195 | 11.1 | 0 | 30 | 30 | |
| IFP | 21,824 | 21,512 | 43,336 | 1.7 | 0 | 5 | 5 | |
| African Independent Congress | 17,538 | 20,332 | 37,870 | 1.5 | 0 | 4 | 4 | |
| Freedom Front Plus | 4,400 | 4,080 | 8,480 | 0.3 | 0 | 1 | 1 | |
| ACDP | 3,524 | 3,951 | 7,475 | 0.3 | 0 | 1 | 1 | |
| Al Jama-ah | 2,796 | 3,911 | 6,707 | 0.3 | 0 | 1 | 1 | |
| UDM | 3,494 | 3,076 | 6,570 | 0.3 | 0 | 1 | 1 | |
| Congress of the People | 1,858 | 2,691 | 4,549 | 0.2 | 0 | 1 | 1 | |
| Patriotic Alliance | 1,688 | 2,150 | 3,838 | 0.2 | 0 | 1 | 1 | |
| Others | 22,349 | 9,749 | 16,817 | 1.3 | 0 | 0 | 0 | |
| Total | 1,258,644 | 1,259,614 | 2,518,258 | 100.0 | 135 | 135 | 270 | |
| Spoilt votes | 16,818 | 18,401 | 35,219 | |||||
In a by-election held on 24 July 2019, a ward previously held by a Democratic Alliance councillor was won by the African National Congress candidate.[32] The council was reconfigured as seen below:
| Party | Ward | PR list | Total | |
|---|---|---|---|---|
| ANC | 85 | 37 | 122 | |
| Democratic Alliance | 50 | 53 | 103 | |
| Economic Freedom Fighters | 0 | 30 | 30 | |
| IFP | 0 | 5 | 5 | |
| African Independent Congress | 0 | 4 | 4 | |
| Freedom Front Plus | 0 | 1 | 1 | |
| ACDP | 0 | 1 | 1 | |
| Al Jama-ah | 0 | 1 | 1 | |
| UDM | 0 | 1 | 1 | |
| Congress of the People | 0 | 1 | 1 | |
| Patriotic Alliance | 0 | 1 | 1 | |
| Total | 135 | 135 | 270 | |
Service provision
The city management team head office is the Metro Centre Complex in Braamfontein, which is responsible for overall administration, financial control, supply of services, and collection of revenues. The fire department and ambulances, the metropolitan police and traffic control, museums, art galleries, and heritage sites are all controlled by separate departments.
Some of the key city service functions are supplied by separate, self-contained entities, each run on business lines with its own CEO.
There are 10 utilities, including electricity which is run by City Power Johannesburg, water and sanitation which is run by Johannesburg Water, and solid waste management, also known as Pikitup. Utilities are registered companies, run on business lines. They must be self-funding, receiving no annual grants from the city. They provide billable services direct to individual households.
Agencies include Johannesburg Roads, City Parks and Johannesburg Development Agency. Each of these performs a service to the public at large – there are no direct charges to individual consumers. These are also structured as separate companies, but they are reliant on the council for funding.
The zoo, Civic Theatre, bus service, fresh produce market and property company each compete in the open market to "sell" their wares to individual consumers who choose to pay for their services. These departments have been "corporatised" into separate businesses, run by new managements on performance contracts, and tasked to cut their subsidy levels by R100-million in the next five years.
See also
References
- "Contact list: Executive Mayors". Government Communication & Information System. Archived from the original on 14 July 2010. Retrieved 22 February 2012.
- "Statistics by place". Statistics South Africa. Retrieved 27 September 2015.
- Smith, David (12 July 2013). "Johannesburg rebuked over 'world-class city' advert". The Guardian. Retrieved 15 July 2013.
- "Executive Mayor's Mid-Term Report" (PDF). City of Johannesburg. July 2003. pp. 9–10, ch 1. NB Report index is here
- World Bank (2003). "Spotlight on Johannesburg". World Development Report 2004: Making Services Work for Poor People. Washington, D.C.: World Bank. pp. 178–179. ISBN 978-0-8213-5468-1.
- Cameron, Robert; Alvarez, Alicia (September 2006). "Metropolitanisation And Political Change in South Africa" (PDF). Centre For Social Science Research, University of Cape Town. p. 5.
- Beavon, Keith S. O. (1997). "Johannesburg: A city and metropolitan area in transformation: Towards an interim local government". In Rakodi, Carole (ed.). The urban challenge in Africa: Growth and management of its large cities. New York: United Nations University Press. Archived from the original on 23 January 2015.
- "8th Conference on Asphalt Pavements for Southern Africa" (PDF). capsa11.co.za. Archived from the original (PDF) on 8 March 2012.
- van der Merwe, Izak; Davids, Arlene (2006). "Cape Town and Johannesburg". In Bekker, Simon B.; Leildé, Anne (eds.). Reflections on Identity in Four African Cities. Stellenbosch, South Africa: African Minds. p. 33. ISBN 978-1-920051-40-2.
- Tomlinson, Richard (2005). "Reinterpreting the Meaning of Decentralization in Johannesburg". In Segbers, Klaus; Raiser, Simon; Volkmann, Krister (eds.). Public Problems—private Solutions?: Globalising Cities in the South. Aldershot, Hampshire, England: Ashgate Publishing. pp. 327–346. ISBN 978-0-7546-4362-3.
- "Investigation into Possible Demarcation of More Metropolitan Authorities and the Extension of the Municipal Areas of Existing Metropolitan Areas" (PDF). Municipal Demarcation Board. 7 May 2008. p. 9.
- Digoamaje, Maria (2004). "Reorganisation of Libraries Under greater johannesburg in the Ddemocratic Era" (PDF). City of Johannesburg. Archived from the original (PDF) on 5 January 2009.
- "Final-term report" (PDF). City of Johannesburg. 12 January 2007. p. 22, ch 1.
- Tabane, Rapule (2 June 2003). "Market produces the goods". Mail and Guardian. South Africa. Archived from the original on 5 January 2014.
- "Restructuring Service Delivery: Johannesburg, South Africa, 1996–2001 (Policy Note 207)". Princeton University. Archived from the original on 5 January 2014. Retrieved 5 January 2014.
- "Lindiwe Mazibuko and Others v City of Johannesburg and Others" (PDF). The Constitutional Court of South Africa. 8 October 2009. Archived (PDF) from the original on 5 January 2014.
- "City Government". City of Johannesburg official website. Archived from the original on 1 August 2003. Retrieved 5 November 2007.
- Abraham, Anish (11 May 2006). "Jozi plans major restructuring". City of Johannesburg. Archived from the original on 27 June 2006.
- Maimane, Mmusi (21 February 2013). "Johannesburg's service delivery is being crippled by maladministration". Democratic Alliance. Archived from the original on 5 January 2014.
- "City of Johannesburg Metropolitan Municipality, Group Annual Financial Statements for the year ended 30 June 2011" (PDF). City of Johannesburg. Archived from the original (PDF) on 5 January 2014.
- Mawson, Nicola (19 February 2013). "Project Phakama bites again". IT Financial. Rivonia, South Africa.
- Chantelle Benjamin And Sarah Hudleston. "Billing crisis could result in qualified audit for Joburg". BusinessDay. Retrieved 15 May 2011.
- Mawson, Nicola (1 February 2011). "Joburg call centre collapses". ITWeb. Retrieved 15 May 2011.
- Gia Nicolaides (24 June 2009). "Joburg connect staff admit they are on a go-slow". Eyewitness News. Archived from the original on 12 March 2012. Retrieved 15 May 2011.
- Africa, Statistics South. "Local Municipality City of Johannesburg". www.statssa.gov.za. Statistics South Africa.
- Archived 23 September 2006 at the Wayback Machine
- Fraser, Neil (10 April 2006). "More competition for inner city on the cards". Johannesburg News Agency. Archived from the original on 2 February 2009.
- "Herman Mashaba elected Johannesburg mayor, marking the end of ANC rule in the city". Mail & Guardian. Retrieved 23 August 2016.
- Adonis, Vusi (4 December 2019). "JUST IN: ANC's Geoff Makhubo is Joburg's new mayor". IOL. Retrieved 4 December 2019.
- "Results Summary – All Ballots: Johannesburg" (PDF). Independent Electoral Commission. Retrieved 17 August 2016.
- "Seat Calculation Detail: Johannesburg" (PDF). Independent Electoral Commission. Retrieved 17 August 2016.
- Sussman, Wayne. ANC and DA swop seats, The Daily Maverick, 25 July 2019. Retrieved 10 August 2019.
.svg.png.webp)