Demography of the Empire of Japan
The population of Japan at the time of the Meiji Restoration was estimated to be 34,985,000 on January 1, 1873,[1] while the official original family registries (本籍, honseki) and de facto (or present registries (現住, genjū)) populations on the same day were 33,300,644 and 33,416,939, respectively. These were comparable to the population of the United Kingdom (31,000,000), France (38,000,000), and Austria-Hungary (38,000,000).
- This article deals with the population of the Empire of Japan. See also demographics of Japan and demographics of Japan before Meiji Restoration.

Japan proper
Total Population
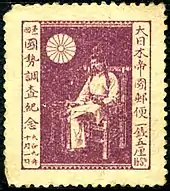
Meiji government established the uniformed registered system of koseki (戸籍, family registries) in 1872, which is called Jinshin koseki (壬申戸籍).
| Year | honseki population |
A-type de facto population |
B-type de facto population |
Estimated population |
|---|---|---|---|---|
| Mar 8, 1872 | 33,110,796 | 33,238,011 | 34,806,000 | |
| Jan 1, 1873 | 33,300,644 | 33,416,939 | 34,985,000 | |
| Jan 1, 1874 | 33,625,646 | 33,749,932 | 35,154,000 | |
| Jan 1, 1875 | 33,997,415 | 33,997,250 | 35,316,000 | |
| Jan 1, 1876 | 34,338,367 | 34,302,068 | 35,555,000 | |
| Jan 1, 1877 | 34,628,328 | 35,870,000 | ||
| Jan 1, 1878 | 34,898,540 | 36,166,000 | ||
| Jan 1, 1879 | 35,768,547 | 36,464,000 | ||
| Jan 1, 1880 | 35,929,023 | 36,649,000 | ||
| Jan 1, 1881 | 36,358,955 | 36,965,000 | ||
| Jan 1, 1882 | 36,700,079 | 37,259,000 | ||
| Jan 1, 1883 | 37,017,262 | 37,569,000 | ||
| Jan 1, 1884 | 37,451,727 | 37,687,645 | 37,451,800 | 37,962,000 |
| Jan 1, 1885 | 37,868,949 | 37,975,069 | 37,704,100 | 38,313,000 |
| Jan 1, 1886 | 38,151,217 | 38,276,376 | 38,147,600 | 38,541,000 |
| Dec 31, 1886 | 38,507,177 | 38,833,415 | 38,530,400 | 38,703,000 (as of Jan 1, 1887) |
| Dec 31, 1887 | 39,069,691 | 39,510,146 | 39,137,100 | 39,029,000 (as of Jan 1, 1888) |
| Dec 31, 1888 | 39,607,234 | 40,105,479 | 39,626,600 | 39,473,000 (as of Jan 1, 1889) |
| Dec 31, 1889 | 40,072,020 | 40,692,808 | 40,076,500 | 39,902,000 (as of Jan 1, 1890) |
| Dec 31, 1890 | 40,453,461 | 40,968,835 | 40,460,300 | 40,251,000 (as of Jan 1, 1891) |
| Dec 31, 1891 | 40,718,677 | 41,268,732 | 40,718,800 | 40,508,000 (as of Jan 1, 1892) |
| Dec 31, 1892 | 41,089,940 | 41,696,847 | 41,083,400 | 40,860,000 (as of Jan 1, 1893) |
| Dec 31, 1893 | 41,388,313 | 42,060,976 | 41,378,600 | 41,142,000 (as of Jan 1, 1894) |
| Dec 31, 1894 | 41,813,215 | 42,430,985 | 41,694,700 | 41,557,000 (as of Jan 1, 1895) |
| Dec 31, 1895 | 42,270,620 | 43,048,226 | 42,225,300 | 41,992,000 (as of Jan 1, 1896) |
| Dec 31, 1896 | 42,708,264 | 43,499,833 | 42,665,300 | 42,400,000 (as of Jan 1, 1897) |
| Dec 31, 1897 | 43,228,863 | 43,978,495 | 43,180,400 | 42,886,000 (as of Jan 1, 1898) |
| Dec 31, 1898 | 43,763,855 | 45,403,041 | 43,716,400 | 43,404,000 (as of Jan 1, 1899) |
| Dec 31, 1899 | 44,270,495 | 44,269,900 | 43,847,000 (as of Jan 1, 1900) | |
| Dec 31, 1900 | 44,825,597 | 44,831,300 | 44,359,000 (as of Jan 1, 1901) | |
| Dec 31, 1901 | 45,446,369 | 45,404,700 | 44,964,000 (as of Jan 1, 1902) | |
| Dec 31, 1902 | 46,041,768 | 45,990,000 | 45,546,000 (as of Jan 1, 1903) | |
| Dec 31, 1903 | 46,732,876 | 48,542,736 | 46,588,000 | 46,135,000 (as of Jan 1, 1904) |
| Dec 31, 1904 | 47,219,566 | 47,197,600 | 46,620,000 (as of Jan 1, 1905) | |
| Dec 31, 1905 | 47,678,396 | 47,819,300 | 47,038,000 (as of Jan 1, 1906) | |
| Dec 31, 1906 | 48,164,761 | 48,451,100 | 47,416,000 (as of Jan 1, 1907) | |
| Dec 31, 1907 | 48,819,630 | 49,092,000 | 47,965,000 (as of Jan 1, 1908) | |
| Dec 31, 1908 | 49,588,804 | 51,742,486 | 49,318,300 | 48,554,000 (as of Jan 1, 1909) |
| Dec 31, 1909 | 50,254,471 | 50,011,700 | 49,184,000 (as of Jan 1, 1910) | |
| Dec 31, 1910 | 50,984,844 | 50,716,600 | 49,852,000 (as of Jan 1, 1911) | |
| Dec 31, 1911 | 51,753,934 | 51,435,400 | 50,577,000 (as of Jan 1, 1912) | |
| Dec 31, 1912 | 52,522,753 | 52,167,000 | 51,305,000 (as of Jan 1, 1913) | |
| Dec 31, 1913 | 53,362,682 | 55,131,270 | 52,911,800 | 52,039,000 (as of Jan 1, 1914) |
| Dec 31, 1914 | 54,142,441 | 53,668,600 | 52,752,000 (as of Jan 1, 1915) | |
| Dec 31, 1915 | 54,935,755 | 54,439,400 | 53,496,000 (as of Jan 1, 1916) | |
| Dec 31, 1916 | 55,637,431 | 55,224,500 | 54,134,000 (as of Jan 1, 1917) | |
| Dec 31, 1917 | 56,335,971 | 56,022,700 | 54,739,000 (as of Jan 1, 1918) | |
| Dec 31, 1918 | 56,667,711 | 58,087,277 | 55,662,900 | 55,033,000 (as of Jan 1, 1919) |
| Dec 31, 1919 | 57,233,906 | 56,253,200 | 55,473,000 (as of Jan 1, 1920) | |
The first national census based on a full sampling of inhabitants was conducted in Japan in 1920 and was conducted every five years thereafter. Per the Statistics Bureau of the Ministry of Internal Affairs and Communications, the population distribution of Japan proper from 1920 to 1945 is as follows [2]
| Date | Population | % Change | Area (km2) | Density (km2) | % Urban |
|---|---|---|---|---|---|
| 1920-10-01 | 55,963,053 | NA | 381,808.04 | 147 | 18.0 |
| 1925-10-01 | 59,736,822 | 6.7 | 381,810.06 | 156 | 21.6 |
| 1930-10-01 | 64,450,005 | 7.9 | 382,264.91 | 169 | 24.0 |
| 1935-10-01 | 69,254,148 | 7.5 | 382,545.42 | 181 | 32.7 |
| 1940-10-01 | 73,114,308 | 5.6 | 382,545.42 | 191 | 37.7 |
| 1945-11-01 | 71,998,104 | -0.7 | 377,298.15 | 195 | 22.8 |
The above figures include Hokkaidō, the northernmost island, sparsely populated, with area similar to the state of Maine; the central island of Honshū, larger than Ohio and Indiana, site of the most important cities and industrial centers; and smaller islands of Kyūshū and Shikoku, and Okinawa (except for the 1945 census values).
Total Fertility Rate from 1874 to 1950
The total fertility rate is the number of children born per woman. It is based on fairly good data for the entire period. Sources: Our World In Data and Gapminder Foundation.[3]
| Years | 1874 | 1875 | 1876 | 1877 | 1878 | 1879 | 1880[3] |
|---|---|---|---|---|---|---|---|
| Total Fertility Rate in Japan | 3.52 | 3.74 | 3.75 | 3.67 | 3.58 | 3.55 | 3.59 |
| Years | 1881 | 1882 | 1883 | 1884 | 1885 | 1886 | 1887 | 1888 | 1889 | 1890[3] |
|---|---|---|---|---|---|---|---|---|---|---|
| Total Fertility Rate in Japan | 3.77 | 3.67 | 3.96 | 3.8 | 3.98 | 4.04 | 4.04 | 4.43 | 4.54 | 4.18 |
| Years | 1891 | 1892 | 1893 | 1894 | 1895 | 1896 | 1897 | 1898 | 1899 | 1900[3] |
|---|---|---|---|---|---|---|---|---|---|---|
| Total Fertility Rate in Japan | 3.99 | 4.4 | 4.26 | 4.35 | 4.36 | 4.51 | 4.66 | 4.72 | 4.73 | 4.69 |
| Years | 1901 | 1902 | 1903 | 1904 | 1905 | 1906 | 1907 | 1908 | 1909 | 1910[3] |
|---|---|---|---|---|---|---|---|---|---|---|
| Total Fertility Rate in Japan | 5.01 | 4.97 | 4.83 | 4.61 | 4.52 | 4.38 | 5.03 | 5.13 | 5.16 | 5.01 |
| Years | 1911 | 1912 | 1913 | 1914 | 1915 | 1916 | 1917 | 1918 | 1919 | 1920[3] |
|---|---|---|---|---|---|---|---|---|---|---|
| Total Fertility Rate in Japan | 5.19 | 5.08 | 5.07 | 5.14 | 4.91 | 4.98 | 4.95 | 4.83 | 4.77 | 5.35 |
| Years | 1921 | 1922 | 1923 | 1924 | 1925 | 1926 | 1927 | 1928 | 1929 | 1930[3] |
|---|---|---|---|---|---|---|---|---|---|---|
| Total Fertility Rate in Japan | 5.22 | 5.12 | 5.26 | 5.07 | 5.22 | 5.19 | 5 | 5.09 | 4.87 | 4.82 |
| Years | 1931 | 1932 | 1933 | 1934 | 1935 | 1936 | 1937 | 1938 | 1939 | 1940[3] |
|---|---|---|---|---|---|---|---|---|---|---|
| Total Fertility Rate in Japan | 4.76 | 4.86 | 4.63 | 4.39 | 4.59 | 4.34 | 4.45 | 3.88 | 3.8 | 4.14 |
| Years | 1941 | 1942 | 1943 | 1944 | 1945 | 1946 | 1947 | 1948 | 1949 | 1950[3] |
|---|---|---|---|---|---|---|---|---|---|---|
| Total Fertility Rate in Japan | 4.36 | 4.18 | 4.11 | 3.95 | 3.11 | 3.37 | 4.51 | 4.38 | 4.3 | 3.44 |
| Date | Population | % Change | Area (km2) | Density (km2) | % Urban |
|---|---|---|---|---|---|
| 1920-10-01 | 55,963,053 | NA | 381,808.04 | 147 | 18.0 |
| 1925-10-01 | 59,736,822 | 6.7 | 381,810.06 | 156 | 21.6 |
| 1930-10-01 | 64,450,005 | 7.9 | 382,264.91 | 169 | 24.0 |
| 1935-10-01 | 69,254,148 | 7.5 | 382,545.42 | 181 | 32.7 |
| 1940-10-01 | 73,114,308 | 5.6 | 382,545.42 | 191 | 37.7 |
| 1945-11-01 | 71,998,104 | -0.7 | 377,298.15 | 195 | 22.8 |
The above figures include Hokkaidō, the northernmost island which is sparsely populated, with area similar to the state of Maine; the central island of Honshū, which is larger than Ohio and Indiana and site of the most important cities and industrial centers; and smaller islands of Kyūshū, Shikoku, and Okinawa (except for the 1945 census values).
Urban Population
In Japan proper, the population of major cities was as follows:
| City or
town |
Japanese | Jan 1,
1873 |
Dec 31,
1886 |
Dec 31,
1889 |
Dec 31,
1893 |
Dec 31,
1898 |
Dec 31,
1903 |
Dec 31,
1908 |
Dec 31,
1913 |
Oct 1,
1920 |
Oct 1,
1925 |
Oct 1,
1930 |
Oct 1,
1935 |
Oct 1,
1940 |
Feb 22,
1944 |
Nov 1,
1945 |
|---|---|---|---|---|---|---|---|---|---|---|---|---|---|---|---|---|
| Tōkyō | 東京 | 595,905 | 1,121,883 | 1,389,684 | 1,214,113 | 1,440,121 | 1,818,655 | 2,186,079 | 2,050,126 | 2,173,201 | 1,995,567 | 2,070,529 | 5,875,667 | 6,778,804 | 6,558,161 | 2,777,010 |
| Ōsaka | 大阪 | 271,992 | 361,694 | 476,271 | 482,961 | 821,235 | 995,945 | 1,226,647 | 1,395,823 | 1,252,983 | 2,114,804 | 2,452,569 | 2,989,874 | 3,252,340 | 2,833,344 | 1,102,959 |
| Nagoya | 名古屋 | 125,193 | 131,492 | 162,767 | 194,796 | 244,145 | 288,639 | 378,231 | 452,043 | 429,997 | 768,558 | 907,402 | 1,082,816 | 1,328,084 | 1,344,100 | 597,941 |
| Yokohama | 横浜 | 64,602 | 89,545 | 121,985 | 152,451 | 193,762 | 326,035 | 394,303 | 397,574 | 422,938 | 405,888 | 620,296 | 704,290 | 968,091 | 1,019,466 | 624,994 |
| Kyōto | 京都 | 238,663 | 245,675 | 279,792 | 317,270 | 353,139 | 380,568 | 442,462 | 509,380 | 591,323 | 679,963 | 765,142 | 1,010,593 | 1,089,726 | 964,466 | 866,153 |
| Kōbe | 神戸 | 40,900 | 80,446 | 135,639 | 153,382 | 215,780 | 285,002 | 378,197 | 442,167 | 608,644 | 644,212 | 787,596 | 912,179 | 967,234 | 918,032 | 379,166 |
| Kawasaki[4] | 川崎 | 3,123 | 4,031 | 5,036 | 4,896 | 5,647 | 5,564 | 7,239 | 10,060 | 21,391 | 54,634 | 104,346 | 154,748 | 300,777 | 380,919 | 180,042 |
| Hiroshima | 広島 | 74,305 | 81,914 | 88,820 | 91,479 | 122,306 | 121,196 | 142,763 | 167,130 | 160,510 | 195,731 | 270,365 | 310,118 | 343,968 | 336,483 | 137,197 |
| Fukuoka[5] | 福岡 | 41,635 | 42,617 | 53,014 | 58,181 | 66,190 | 71,047 | 82,106 | 97,303 | 95,381 | 146,005 | 228,290 | 291,158 | 306,763 | 324,499 | 252,282 |
| Yokosuka | 横須賀 | 2,810 | 13,251 | 24,366 | 24,366 | 24,750 | 36,956 | 70,964 | 85,478 | 89,879 | 96,351 | 110,304 | 182,871 | 193,358 | 298,132 | 202,038 |
| Miyahara/ Washō/ Kure[6] | 宮原/ 和庄/ 呉 | n. d. | 11,160 | 7,335 | 11,648 | 21,553 | 66,006 | 100,679 | 128,342 | 130,362 | 138,863 | 190,265 | 231,333 | 238,195 | 293,632 | 152,184 |
| Nagasaki | 長崎 | 29,656 | 38,229 | 55,063 | 65,374 | 107,422 | 153,293 | 176,480 | 161,174 | 176,534 | 189,071 | 204,179 | 211,702 | 252,630 | 270,113 | 142,748 |
| Amagasaki | 尼崎 | 12,404 | 12,742 | 13,580 | 13,955 | 15,066 | 18,006 | 19,888 | 25,045 | 38,461 | 44,241 | 50,064 | 71,072 | 181,011 | 270,073 | 153,051 |
| Sendai | 仙台 | 51,998 | 61,709 | 90,231 | 73,771 | 83,325 | 100,231 | 97,944 | 104,141 | 118,984 | 142,894 | 190,177 | 219,547 | 223,630 | 261,117 | 238,250 |
| Yahata[4] | 八幡 | n. d. | n. d. | 3,068 | 2,309 | 3,014 | 7,592 | 22,767 | 45,630 | 100,235 | 118,376 | 168,218 | 208,629 | 261,309 | 252,662 | 151,378 |
| Sasebo[6] | 佐世保 | n. d. | n. d. | 8,005 | 13,122 | 37,485 | 68,344 | 93,051 | 94,914 | 87,022 | 95,385 | 133,172 | 173,283 | 205,989 | 241,239 | 147,617 |
| Sapporo | 札幌 | 1,785 | 15,041 | 16,876 | 27,694 | 37,482 | 55,304 | 70,084 | 96,924 | 102,580 | 145,065 | 168,575 | 196,541 | 206,103 | 225,842 | 220,139 |
| Sakai | 堺 | 38,838 | 44,015 | 48,165 | 46,138 | 50,203 | 54,040 | 61,103 | 67,706 | 84,999 | 105,009 | 120,347 | 141,286 | 182,147 | 217,939 | 168,348 |
| Shizuoka | 静岡 | 31,555 | 36,838 | 37,664 | 37,096 | 42,172 | 48,744 | 53,614 | 64,108 | 74,093 | 84,772 | 136,481 | 200,737 | 212,198 | 211,666 | 161,720 |
| Kumamoto | 熊本 | 44,620 | 44,384 | 52,833 | 62,432 | 61,463 | 59,717 | 61,233 | 68,167 | 70,388 | 147,174 | 164,449 | 187,382 | 194,193 | 211,011 | 181,128 |
| Akamazeki/ Shimonoseki | 赤間関/ 下関 | 18,500 | 30,825 | 29,919 | 33,565 | 42,786 | 46,285 | 58,254 | 72,117 | 72,300 | 92,317 | 98,549 | 132,737 | 196,022 | 206,961 | 155,623 |
| Wakayama | 和歌山 | 61,124 | 54,868 | 56,713 | 55,726 | 63,667 | 68,527 | 77,303 | 77,683 | 83,500 | 95,622 | 117,437 | 179,732 | 195,203 | 205,396 | 147,523 |
| Hakodate | 函館 | 28,825 | 45,477 | 52,909 | 63,619 | 78,040 | 85,313 | 87,875 | 99,795 | 144,749 | 163,972 | 197,252 | 207,480 | 203,862 | 196,680 | 181,531 |
| Kanazawa | 金沢 | 109,685 | 97,653 | 94,257 | 91,531 | 83,662 | 99,657 | 110,994 | 129,804 | 129,265 | 147,420 | 157,309 | 163,733 | 186,297 | 193,560 | 200,584 |
| Kagoshima | 鹿児島 | 27,240 | 45,097 | 57,465 | 56,139 | 53,481 | 59,001 | 63,640 | 75,907 | 103,180 | 124,734 | 137,232 | 181,736 | 190,257 | 189,991 | 93,698 |
| Niigata | 新潟 | 33,152 | 40,778 | 46,353 | 49,700 | 53,366 | 59,576 | 61,616 | 66,622 | 92,130 | 108,941 | 125,106 | 134,992 | 150,903 | 177,289 | 174,170 |
| Okayama | 岡山 | 32,372 | 32,989 | 48,333 | 51,665 | 58,025 | 81,025 | 93,421 | 86,961 | 94,585 | 124,521 | 139,221 | 166,144 | 163,552 | 160,902 | 92,861 |
| Toyama | 富山 | 44,682 | 53,556 | 58,159 | 58,187 | 59,558 | 56,275 | 57,437 | 64,822 | 61,812 | 67,490 | 75,099 | 83,324 | 127,859 | 160,537 | 100,775 |
| Otaru | 小樽 | 3,903 | 15,882 | 12,629 | 34,259 | 56,961 | 79,361 | 91,281 | 92,864 | 108,113 | 134,469 | 144,884 | 153,587 | 164,282 | 151,905 | 145,510 |
| Kōchi | 高知 | 39,757 | 30,987 | 32,241 | 34,711 | 36,511 | 35,518 | 38,279 | 39,162 | 49,329 | 65,723 | 96,991 | 103,405 | 106,644 | 136,699 | 111,630 |
| Tokushima | 徳島 | 48,861 | 57,456 | 61,107 | 61,337 | 61,501 | 63,710 | 65,561 | 70,292 | 68,457 | 74,545 | 90,622 | 97,021 | 119,581 | 116,734 | 80,681 |
| Takamatsu | 高松 | 32,736 | 37,698 | 32,081 | 35,330 | 34,416 | 37,430 | 42,578 | 41,837 | 46,550 | 71,897 | 79,906 | 86,840 | 111,207 | 107,202 | 72,656 |
| Fukui | 福井 | 39,784 | 37,376 | 40,849 | 42,680 | 44,286 | 50,155 | 50,396 | 56,218 | 56,639 | 59,943 | 64,199 | 75,273 | 94,595 | 99,477 | 45,559 |
| Akita | 秋田 | 38,118 | 29,225 | 29,568 | 28,229 | 29,477 | 34,350 | 36,294 | 36,560 | 36,281 | 43,887 | 51,070 | 60,646 | 61,791 | 97,361 | 101,009 |
| Matsue | 松江 | 37,308 | 33,381 | 35,934 | 35,409 | 34,651 | 35,081 | 36,209 | 38,631 | 37,527 | 41,396 | 44,502 | 52,033 | 55,506 | 54,282 | 54,033 |
| Hagi | 萩 | 45,318 | 21,206 | 19,804 | 19,274 | 15,877 | 18,114 | 18,069 | 17,129 | 14,386 | 33,225 | 32,106 | 32,587 | 32,270 | 30,960 | 38,388 |
| Shuri | 首里 | 44,984 | 25,587 | 26,205 | 25,359 | 24,809 | 23,827 | 25,141 | 24,102 | 22,838 | 20,582 | 20,199 | 19,305 | 17,537 | 17,964 | n.d. |
In 1937 Japanese demographers projected the Japanese population in 1980 to reach 100,000,000, in accordance with observed growth rates.
Japanese overseas possessions
Japan annexed Taiwan after the First Sino-Japanese War, while victory in the Russo-Japanese War gained Japan the Kwantung Leased Territory, Karafuto, and Korea. These acquisitions increased the area controlled by Japanese to 262,912 square miles (680,939 km2).
The total population of the Empire of Japan, including Taiwan, Korea, and Karafuto was 64,940,034 on Dec 31, 1908, which could be broken down as follows:
- Japan proper: 51,742,486
- Korea: 9,918,566
- Taiwan: 3,252,589
- Karafuto: 26,393
And the population of concessions as of Dec 31, 1908, was as follows:
- Kwantung: 427,117
- Railway Zone: 28,307
| Territory | 1920-10-01 | 1925-10-01 | 1930-10-01 | 1935-10-01 | 1940-10-01 | Area as of 1920 (km2) |
|---|---|---|---|---|---|---|
| Empire of Japan | 76,988,379 | 83,456,929 | 90,396,043 | 97,697,555 | 103,727,610 | 674,612.076 |
| Japan Proper | 55,963,053 | 59,736,822 | 64,450,005 | 69,254,148 | 73,114,308 | 381,808.042 |
| Taiwan | 3,655,308 | 3,993,408 | 4,592,537 | 5,212,426 | 5,872,084 | 35,973.550 |
| Korea | 17,264,119 | 19,522,945 | 21,058,305 | 22,899,038 | 24,326,327 | 220,740.718 |
| Karafuto | 105,899 | 203,754 | 295,196 | 331,943 | 414,891 | 36,089.766 |
| Concessions | 919,568 | 1,054,074 | 1,328,011 | 1,656,726 | 1,367,334 | 4,168.804 |
| Kwantung | 688,130 | 765,776 | 955,741 | 1,134,081 | 1,367,334 | 3,374.655 |
| Railway Zone | 231,438 | 288,298 | 372,270 | 522,645 | To Manchuria | 242.149 |
| Tsingtao | 248,209 | To Republic of China | 552.000 | |||
| South Pacific Mandate | 52,222 | 56,294 | 69,626 | 102,537 | 131,258 | 2,514.026 |
| Total | 78,208,378 | 84,567,297 | 91,793,680 | 99,456,818 | 105,226,202 | 681,294.906 |
The census population in 1940
- Japan proper: 73,114,308 (of whom 71,810,022 were Japanese, 1,241,315 were Koreans, 22,499 were Taiwanese, 986 were Karafuto natives, 249 were South Pacific natives and 39,237 of other nationalities).
- Manchukuo: 41,080,907 inhabitants, including 38,880,542 Hans and Manchurian, 1,309,000 Koreans, 819,582 Japanese, 5,000 Taiwanese and 66,783 of other nationalists;
- Korea: 24,326,327 (of whom 707,742 were Japanese, 23,547,465 were Koreans, 226 were Taiwanese, 2 were South Pacific natives and 70,892 of other nationalities).
- Formosa: 5,872,083 (of whom 312,386 were Japanese, 5,510,259 were Taiwanese, 2,376 were Koreans, and 46,834 Hans and 228 of other nationalities).
- Mengjiang: 5,525,833 with 5,019,987 Han, while the population of Mongolia was 154,203.
- Karafuto: 414,892 (of whom 394,603 were Japanese, 19,505 were Koreans, 396 were Karafuto natives, 35 were Taiwanese, and 352 of other nationalities).
- Kwantung: 1,367,334 (of whom 198,188 were Japanese, 6,384 were Koreans, 550 were Taiwanese, 1,158,083 were of Manchurian nationality, and 4,129 of other nationalities).
- South Seas Mandate: 131,258 (of whom 77,011 were Japanese, 50,648 were South Pacific natives, 3,472 were Koreans, 7 were Taiwanese, and 120 of other nationalities).
Total: 151,481,298 (of whom 74,319,534 were Japanese, 26,129,517 were Koreans, 5,538,576 were Taiwanese, 50,899 were South Pacific natives, 1,382 were Karafuto natives, 45,105,446 were of Manchurian and Han , and 154,203 of other nationalities).
Estimated populations in 1940 in other occupied territories
China-Nanking Republic: 182,604,000
Hainan Island: 2,200,000
Kwangchow: 1,238,000
Shantou: 237,000
Fuzhou: 223,000
Amoy: 113,000
Kinmen Island: 50,000
Chishima Islands: 10,972
Urban population in overseas territories
In terms of cities, the population of major cities:
| Rank | City | 1890 census | 1910 census | 1920 census | 1930 census | 1940 census |
|---|---|---|---|---|---|---|
| 1 | Keijō | 1,165,000 | 230,000 | 247,000 | 350,000 | 1,100,000 |
| 2 | Fuzan | NA | 81,000 | 74,000 | 130,000 | 400,000 |
| 3 | Heijō | NA | 40,000 | 60,000 | 137,000 | 286,000 |
| 4 | Jinsen | NA | 30,000 | 40,000 | 54,000 | 171,000 |
| 5 | Taihoku | 78,000 | 95,000 | 164,000 | 249,000 | 326,000 |
| 6 | Tainan | NA | 44,000 | 112,000 | 166,000 | 296,000 |
| 7 | Kīrun | NA | NA | 48,000 | 79,000 | 100,000 |
Taiwan and Korea
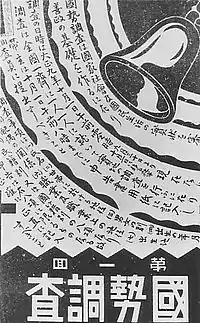
| Year | Population (Taiwan) | Population (Korea) |
|---|---|---|
| 1897 | 2,728,800 | NA |
| 1900 | 3,046,000 | 11,310,000 |
| 1920 | 3,654,900 | 17,264,100 |
| 1925 | 3,994,900 | 19,522,900 |
| 1930 | 4,679,100 | 21,058,300 |
| 1935 | 5,212,400 | 22,899,000 |
| 1940 | 5,872,100 | 24,730,000 |
| 1945 | 6,940,000 | 27,275,000 |
Manchukuo
By the time of 1908, the population of Manchuria was 15.83 million people and on October 1, 1932, when Manchukuo was founded, it had become 29,280,008 people. The population of Manchuria in early 1934 was estimated at 30,880,000. These numbers included 30,190,000 Chinese, 590,760 Japanese and 98,431 other nationalities (Russians, Mongols etc.). Chinese numbers included 680,000 ethnic Koreans. Approximately 300,000 men were added to the Japanese military garrison in 1937. Between 1938 and 1942, a contingent of 200,000 young farmers arrived in Manchukuo; joining this group after 1936, there were 20,000 complete families. In Shinkyō, the Japanese made up 25% of the population.
At the end of 1938, the total population of Manchukuo was estimated at 36,933,000, including approximately 1 million Japanese civilians and 500,000 Japanese military personnel. These figures exclude the rented territory of Kwantung and Dalian, which were included in Japanese territories abroad.
In 1940, the Manchurian State Council census had a population of 41,080,907 inhabitants, including 38,880,542 Hans and Manchurian, 1,309,000 Koreans, 819,582 Japanese, 5,000 Taiwanese and 66,783 of other nationalists; the proportion of men to women was 123.8 / 100.
As of October 1, 1942, the population had increased to 44,240,002 people.
At the end of the war, 850,000 Japanese migrants were arrested when the Soviet Union invaded Manchuria. Basically, with the exception of public and military officers, these people were repatriated in stages from 1946 to 1947 to Japan under Allied occupation.
References
- Population of Japan after Meiji 5 compiled by the Cabinet Bureau of Statistics of Japan in 1930.
- Statistics Bureau, The Population of Japan
- Max Roser (2014), "Fertility Rate", Our World In Data, Gapminder Foundation
- Population in 1889 and 1893 excludes military residents and prisoners.
- Population in 1873 includes those of Hakata (20,985) and Fukuoka (20,650). Population in 1879 includes those of Hakata (22,954) and Fukuoka (19,663).
- Population in 1889 excludes military residents and prisoners.
Books
- Taeuber Irene B., and Beal, Edwin G. The Demographic Heritage of the Japanese Empire,
- Annals of the American Academy of Political and Social Science, Vol. 237, World Population in Transition (Jan. 1945), pp. 64–71
External links
- Population of Japan, Statistics Bureau
- Kindai Digital Library at the National Diet Library of Japan (original texts in Japanese)
- Imperial Japan Static Population Statistics as of December 31, 1908 (de facto populations since 1885 with French notations)
- Japan Registered Population Tables as of January 1, 1874 (Japanese only)
- DSpace at Waseda University
- Kokudaka and population Table (Okuma Shigenobu Collection, original text in Japanese)
- Boys, Anthony FF, World Population, 2000
- Wendell Cox Consultancy
- New York Times, Mar 2, 1921
- Asian Population Statistics
