Division of Herbert
The Division of Herbert is an Australian electoral division in the state of Queensland. Eligible voters within the Division elect a single representative, known as the member for Herbert, to the Australian House of Representatives.
| Herbert Australian House of Representatives Division | |
|---|---|
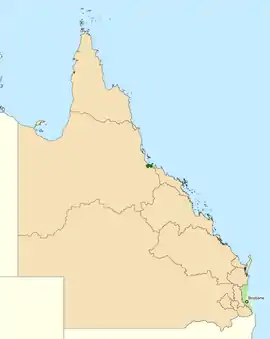 Division of Herbert in Queensland, as of the 2019 federal election. | |
| Created | 1901 |
| MP | Phillip Thompson |
| Party | Liberal National |
| Namesake | Sir Robert Herbert |
| Electors | 108,434 (2019) |
| Area | 946 km2 (365.3 sq mi) |
| Demographic | Provincial |
History
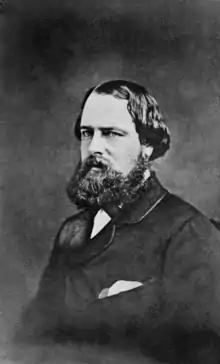
The division was proclaimed in 1900, and was one of the original 65 divisions to be contested at the first federal election. It is located in northern Queensland, and is named after Sir Robert Herbert, the first Premier of Queensland (1859–1866). It has always been based around the city of Townsville.
On its original boundaries, it covered most of northeastern Queensland, stretching from Mackay to the Torres Strait. Much of its northern portion, including Cairns and the Cape York Peninsula, transferred to Kennedy in 1934 (these areas are now part of Leichhardt. Its south-eastern portion, including Mackay, became Dawson in 1949. By 1984, successive redistributions cut back the seat to little more than Townsville and its inner suburbs.
The seat had long been one of Australia's noteworthy bellwether seats. It was won by the party of government for all but two terms from the 1966 election until the 2007 election, where it was hotly contested with local identity and businessman George Colbran pre-selected by Labor to contest Herbert, however Liberal incumbent Peter Lindsay managed to retain the seat with a wafer-thin 50.2 percent two-party vote from a 6 percent two-party swing while his party lost government. Ewen Jones of the merged Liberal National Party succeeded Lindsay and retained the seat at the following two elections with increased margins.
Herbert featured the closest result of any division at the 2016 federal election. Following a recount, the Australian Electoral Commission confirmed on 31 July that Labor's Cathy O'Toole defeated the LNP incumbent by 37 votes, becoming the first Labor member to win the seat since 1996.[1][2] The LNP considered a legal challenge to the result.[2][3]
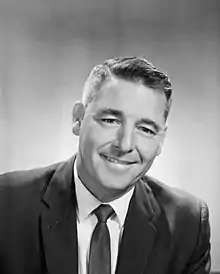
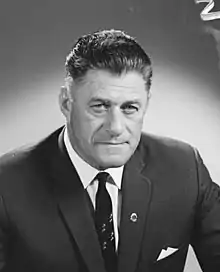
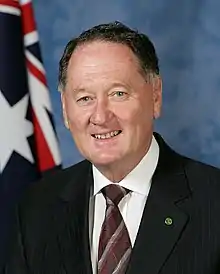
Members
Election results
| Party | Candidate | Votes | % | ±% | |
|---|---|---|---|---|---|
| Liberal National | Phillip Thompson | 34,112 | 37.11 | +1.61 | |
| Labor | Cathy O'Toole | 23,393 | 25.45 | −5.00 | |
| One Nation | Amy Lohse | 10,189 | 11.09 | −2.44 | |
| Katter's Australian | Nanette Radeck | 9,007 | 9.80 | +2.93 | |
| Greens | Sam Blackadder | 6,721 | 7.31 | +1.05 | |
| United Australia | Greg Dowling | 5,239 | 5.70 | +5.70 | |
| Conservative National | Tamara Durant | 1,671 | 1.82 | +1.82 | |
| Animal Justice | Mackenzie Severns | 1,585 | 1.72 | +1.72 | |
| Total formal votes | 91,917 | 94.10 | +0.98 | ||
| Informal votes | 5,759 | 5.90 | −0.98 | ||
| Turnout | 97,676 | 90.06 | −0.83 | ||
| Two-party-preferred result | |||||
| Liberal National | Phillip Thompson | 53,641 | 58.36 | +8.38 | |
| Labor | Cathy O'Toole | 38,276 | 41.64 | −8.38 | |
| Liberal National gain from Labor | Swing | +8.38 | |||
References
- Labor takes seat of Herbert, leaving Malcolm Turnbull with majority of just one seat: SMH 31 July 2016
- Labor wins seat of Herbert after recount: ABC 31 July 2016
- "LNP to consider legal action if it loses Herbert recount". Courier Mail. 29 July 2016.
- Herbert, QLD, Tally Room 2019, Australian Electoral Commission.
.jpg.webp)



.jpg.webp)


.jpg.webp)