1958 Australian federal election
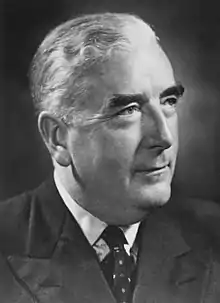
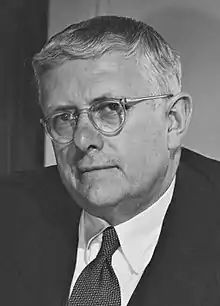
The 1958 Australian federal election was held in Australia on 22 November 1958. All 122 seats in the House of Representatives and 32 of the 60 seats in the Senate were up for election. The incumbent Liberal–Country coalition led by Prime Minister Robert Menzies defeated the opposition Labor Party, led by H. V. Evatt.
| |||||||||||||||||||||||||||||||
All 122 seats of the House of Representatives 62 seats were needed for a majority in the House 32 (of the 60) seats of the Senate | |||||||||||||||||||||||||||||||
|---|---|---|---|---|---|---|---|---|---|---|---|---|---|---|---|---|---|---|---|---|---|---|---|---|---|---|---|---|---|---|---|
| |||||||||||||||||||||||||||||||
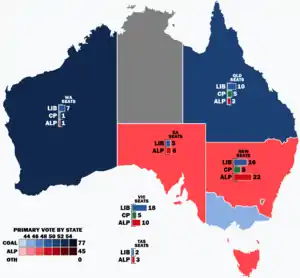 Popular vote by state with graphs indicating the number of seats won. As this is an IRV election, seat totals are not determined by popular vote by state but instead via results in each electorate. | |||||||||||||||||||||||||||||||
| |||||||||||||||||||||||||||||||
Issues
In spite of a major global downturn in early 1958, the Coalition was returned to power and there was an even swing against the Labor Party. This was due largely to support for the breakaway Democratic Labor Party. This was the first Australian election campaign to be fought using television as a medium for communicating with voters. Menzies was interviewed on television, while opposition figures H. V. Evatt and Arthur Calwell took part in debates with ministers Harold Holt and William McMahon. Somewhat surprisingly Menzies emerged as a confident and effective television performer. This may have contributed to the better than expected result for the government.
Results
House of Representatives
| Party | Votes | % | Swing | Seats | Change | ||
|---|---|---|---|---|---|---|---|
| Liberal–Country coalition | 2,298,512 | 46.55 | –1.12 | 77 | +2 | ||
| Liberal | 1,859,180 | 37.23 | −2.52 | 58 | +1 | ||
| Country | 465,320 | 9.32 | +1.41 | 19 | +1 | ||
| Labor | 2,137,890 | 42.81 | −1.84 | 45 | −2 | ||
| Democratic Labor | 389,688 | 7.80 | +2.63 | 0 | 0 | ||
| Queensland Labor | 80,035 | 1.60 | +1.60 | 0 | 0 | ||
| Communist | 26,337 | 0.53 | –0.63 | 0 | 0 | ||
| Nationalist | 3,577 | 0.07 | +0.07 | 0 | 0 | ||
| Independent | 31,466 | 0.63 | –0.74 | 0 | 0 | ||
| Total | 4,993,493 | 122 | |||||
| Two-party-preferred (estimated) | |||||||
| Liberal–Country coalition | WIN | 54.10 | −0.10 | 77 | +2 | ||
| Labor | 45.90 | +0.10 | 45 | −2 | |||
Senate
| Party | Votes | % | Swing | Seats Won | Seats Held | Change | ||
|---|---|---|---|---|---|---|---|---|
| Liberal–Country coalition | 2,084,193 | 45.19 | –3.49 | 16 | 32 | +2 | ||
| Liberal–Country joint ticket | 1,077,586 | 23.36 | –16.02 | 9 | N/A | N/A | ||
| Liberal | 953,856 | 20.68 | +12.02 | 6 | 25 | +1 | ||
| Country | 52,751 | 1.14 | +0.51 | 1 | 7 | +1 | ||
| Labor | 1,973,027 | 42.78 | +2.17 | 15 | 26 | –2 | ||
| Democratic Labor | 314,755 | 6.82 | +0.72 | 1 | 2 | 0 | ||
| Communist | 134,263 | 2.91 | −0.73 | 0 | 0 | 0 | ||
| Queensland Labor | 73,037 | 1.66 | +1.66 | 0 | 0 | 0 | ||
| Other | 12,511 | 0.27 | +0.27 | 0 | 0 | 0 | ||
| Independents | 20,273 | 0.44 | –0.46 | 0 | 0 | 0 | ||
| Total | 4,612,059 | 32 | 60 | |||||
- Notes
- The Democratic Labor Party was the renamed "Anti-Communist Labor Party" from the 1955 election.
- "Other" includes 4,459 votes for "Loyalist" candidates, 4,337 for "True Democrat" candidates, and 3,715 for "Republican" candidates.
Seats changing hands
| Seat | Pre-1958 | Swing | Post-1958 | ||||||
|---|---|---|---|---|---|---|---|---|---|
| Party | Member | Margin | Margin | Member | Party | ||||
| Braddon, Tas | Liberal | Aubrey Luck | 8.9 | 9.3 | 0.4 | Ron Davies | Labor | ||
| Griffith, Qld | Labor | Wilfred Coutts | 1.3 | 1.4 | 0.1 | Arthur Chresby | Liberal | ||
| Herbert, Qld | Labor | Bill Edmonds | 6.6 | 8.1 | 1.5 | John Murray | Liberal | ||
| Indi, Vic | Liberal | William Bostock | N/A | 28.6 | 6.5 | Mac Holten | Country | ||
| Kalgoorlie, WA | Labor | Herbert Johnson | N/A | 11.4 | 0.3 | Peter Browne | Liberal | ||
| Moore, WA | Country | Hugh Leslie | 100.0 | 52.9 | 2.9 | Hugh Halbert | Liberal | ||
| St George, NSW | Liberal | Bill Graham | 2.4 | 2.5 | 0.1 | Lionel Clay | Labor | ||
| Stirling, WA | Labor | Harry Webb | 2.8 | 3.0 | 0.2 | Doug Cash | Liberal | ||
| Wimmera, Vic | Liberal | William Lawrence | N/A | 22.7 | 5.9 | Robert King | Country | ||
- Members in italics did not contest their seat at this election.
See also
Notes
References
- University of WA election results in Australia since 1890
- AEC 2PP vote
- Prior to 1984 the AEC did not undertake a full distribution of preferences for statistical purposes. The stored ballot papers for the 1983 election were put through this process prior to their destruction. Therefore, the figures from 1983 onwards show the actual result based on full distribution of preferences.
| Federal elections | |
|---|---|
| Referendums | |
| |