Dobretići
Dobretići (Serbian Cyrillic: Добретићи) is a village and municipality located in Central Bosnia Canton of the Federation of Bosnia and Herzegovina, an entity of Bosnia and Herzegovina. It is one of the youngest and smallest municipalities in Bosnia and Herzegovina hence being one of the poorest municipalities as well. Before the Bosnian War municipality of Dobretići was part of municipality Skender Vakuf (today Kneževo).
Dobretići | |
|---|---|
Village and municipality | |
 Coat of arms | |
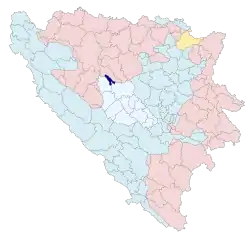 Location of Dobretići within Bosnia and Herzegovina. | |
| Coordinates: 44°23′N 17°25′E | |
| Country | Bosnia and Herzegovina |
| Entity | Federation of Bosnia and Herzegovina |
| Government | |
| • Municipality president | Ivo Čakarić (HSS SR) |
| Area | |
| • Total | 59 km2 (23 sq mi) |
| Population (2013 census) | |
| • Total | 1,629 |
| • Density | 35/km2 (90/sq mi) |
| Time zone | UTC+1 (CET) |
| • Summer (DST) | UTC+2 (CEST) |
| Area code(s) | +387 30 |
Name
The municipality of Dobretići was in the prior censuses known as Dobratići. After the Bosnian War, the name of the village became Dobretići, to align it with the name of medieval Bosnian aristocrat Stjepan Dobreta. The locals of the municipality like to call the area around the village Pougarje, after the local river, the Ugar.
Geography
It is located on the mountain of Ranča in the Central Bosnia Canton of the Federation of Bosnia and Herzegovina. The municipality is 20 kilometers northeast from the town of Jajce.
Administrative divisions
Today's municipality is made of 18 settlements: Brnjići, Bunar, Davidovići, Dobretići, Donji Orašac, Gornji Orašac, Kričići-Jejići, Melina, Mijatovići, Milaševci, Pavlovići, Prisika, Slipčevići, Vitovlje Malo, Vukovići, Zapeće, Zasavica i Zubovići.
Demographics
Population
| Population of settlements – Dobretići municipality | |||||
|---|---|---|---|---|---|
| Settlement | 1971. | 1981. | 1991. | 2013. | |
| Total | 4,790 | 1,629 | |||
| 1 | Dobretići | 190 | 318 | 336 | 228 |
| 2 | Zubovići | 375 | 259 | ||
Ethnic composition
| Ethnic composition – Dobretići village | |||||||
|---|---|---|---|---|---|---|---|
| 2013. | 1991. | 1981. | 1971. | ||||
| Total | 228 (100,0%) | 336 (100,0%) | 318 (100,0%) | 190 (100,0%) | |||
| Croats | 228 (100,0%) | 315 (93,75%) | 271 (85,22%) | 173 (91,05%) | |||
| Yugoslavs | 15 (4,464%) | 6 (1,887%) | |||||
| Bosniaks | 3 (0,893%) | 1 (0,526%) | |||||
| Serbs | 3 (0,893%) | 32 (10,06%) | 12 (6,316%) | ||||
| Others | 5 (1,572%) | 1 (0,526%) | |||||
| Montenegrins | 3 (0,943%) | 3 (1,579%) | |||||
| Hungarians | 1 (0,314%) | ||||||
| Ethnic composition – Dobretići municipality | |||||||
|---|---|---|---|---|---|---|---|
| 2013. | 1991. | ||||||
| Total | 1,629 (100,0%) | 4,790 (100,0%) | |||||
| Croats | 1,626 (99,82%) | 4,720 (98,54%) | |||||
| Others | 2 (0,123%) | 42 (0,877%) | |||||
| Serbs | 1 (0,061%) | 6 (0,125%) | |||||
| Yugoslavs | 19 (0,397%) | ||||||
| Bosniaks | 3 (0,063%) | ||||||
References
External links
 Media related to Dobretići at Wikimedia Commons
Municipalities of the Central Bosnia Canton | ||
|---|---|---|