Global Hunger Index
The Global Hunger Index (GHI) is a tool that measures and tracks hunger globally as well as by region and by country. The GHI is calculated annually, and its results appear in a report issued in October each year.[1][2]
After declining since 2000, hunger at the global level is classified as moderate, according to the 2020 report. Many individual countries have also achieved reductions in hunger since 2000, but in some countries hunger persists or has even worsened.
About the Global Hunger Index Report
Created in 2006, the GHI was initially published by the US-based International Food Policy Research Institute (IFPRI) and Germany-based Welthungerhilfe. In 2007, the Irish NGO Concern Worldwide also became a co-publisher.[3][4][5][6][7][8][9][10][11][12][13][14][15][16] In 2018, IFPRI stepped aside from its involvement in the project and the GHI became a joint project of Welthungerhilfe and Concern Worldwide.[17]
The 2020 Global Hunger Index report presents a multi-dimensional measure of national, regional, and global hunger by assigning a numerical score based on several aspects of hunger. It then ranks countries by GHI score and compares current scores with past results. Besides presenting GHI scores, each year the GHI report includes an essay addressing one particular aspect of hunger. The 2020 report considers a One Health approach to linking health and sustainable food systems in order to achieve Zero Hunger by 2030.
Calculation of GHI Scores
The Global Hunger Index measures hunger on a 100-point scale, with 0 being the best score (no hunger) and 100 being the worst, although neither of these extremes is reached in practice. The severity of hunger associated with the range of possible GHI scores is as follows: [18]
| Level | Value |
|---|---|
| Low | 9.9 |
| Moderate | 10.0-19.9 |
| Serious | 20.0-34.9 |
| Alarming | 35.0-49.9 |
| Extremely alarming | ≥ 50.0 |
The GHI combines 4 component indicators: [GHI2016 1]
- the proportion of the undernourished as a percentage of the population;
- the proportion of children under the age of five suffering from wasting, a sign of acute undernutrition;
- the proportion of children under the age of five suffering from stunting, a sign of chronic undernutrition; and
- the mortality rate of children under the age of five.
In 2020, data were assessed for the 132 countries that met the criteria for inclusion in the GHI, and GHI scores were calculated for 107 of those countries based on data from 2015 to 2019. Data to calculate GHI scores come from published United Nations sources (Food and Agriculture Organization of the United Nations,[19] World Health Organization, UNICEF, and Inter-agency Group for Child Mortality Estimation[20]), the World Bank, and Demographic and Health Surveys. Of the 132 countries assessed, 25 did not have sufficient data to allow for the calculation of a 2020 GHI score, but provisional designations of the severity of hunger were assigned to 18 of those countries based on other known data. For the remaining 7 countries, data were insufficient to allow for either calculating GHI scores or assigning provisional categories.
In previous years, topics included:
- 2010: Early childhood undernutrition among children younger than the age of two.[21]
- 2011: Rising and more volatile food prices of the recent years and the effects these changes have on hunger and malnutrition.[22]
- 2012: Achieving food security and sustainable use of natural resources, when the natural sources of food become increasingly scarce.[23]
- 2013: Strengthening community resilience against undernutrition and malnutrition.[24]
- 2014: Hidden hunger, a form of undernutrition characterized by micronutrient deficiencies.[25]
- 2015: Armed conflict and its relation to hunger.[26]
- 2016: Reaching the UN Sustainable Development Goal of zero hunger by 2030.[27]
- 2017: The challenges of inequality and hunger.[28]
- 2018: Forced migration and hunger.[29]
- 2019: The challenge of hunger and climate change.[30]
In addition to the yearly GHI, the Hunger Index for the States of India (ISHI) was published in 2008[31] and the Sub-National Hunger Index for Ethiopia was published in 2009.[32]
An interactive map allows users to visualize the data for different years and zoom into specific regions or countries.
Global and regional trends
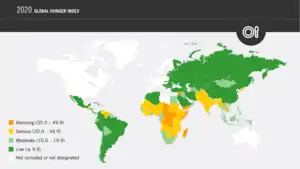
Hunger worldwide, represented by a GHI score of 18.2, is at a moderate level, down from a 2000 GHI score of 28.2, classified as serious.
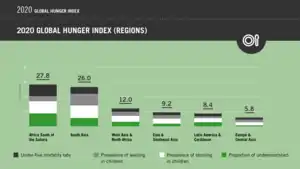
Hunger varies enormously by region. In both Africa South of the Sahara and South Asia, hunger is classified as serious, owing partly to large shares of people who are undernourished and high rates of child stunting. Moreover, Africa South of the Sahara has the world’s highest child mortality rate, while South Asia has the world’s highest child wasting rate.
In contrast, hunger levels in Europe and Central Asia, Latin America and the Caribbean, East and Southeast Asia, and West Asia and North Africa are characterized as low or moderate, although hunger is high among certain groups within countries in these regions.
In 2020, the COVID-19 pandemic and the resulting economic downturn, as well as a massive outbreak of desert locusts in the Horn of Africa and other crises, are exacerbating food and nutrition insecurity for millions of people, as these crises come on top of existing hunger caused by conflict, climate extremes, and economic shocks. The GHI scores presented in the 2020 GHI report do not yet reflect the impact of the overlapping disasters of 2020, but they point to hot spots where food insecurity and undernutrition are already severe, putting their populations at greater risk of acute food crises and chronic hunger in the future.
Country rankings
Country rankings as per the Global Hunger Index. [33]
Legend
Countries where hunger is low (GHI ≤9.9) |
Countries where hunger is moderate (GHI = 10.0–19.9) |
Countries where hunger is serious (GHI = 20.0–34.9) |
Countries where hunger is alarming (GHI = 35.0–49.9) |
Countries where hunger is extremely alarming (GHI ≥50.0) |
| Rank (2020) | Country | Continent | Period | Average period decrease | ||||
|---|---|---|---|---|---|---|---|---|
| 2000 | 2006 | 2012 | 2020[34] | Actual | Percentage | |||
| 1–17 | Europe | <5 | <5 | <5 | <5 | 0.00 | 0.00 | |
| 1–17 | Europe | 9.3 | 6.7 | <5 | <5 | 0.00 | 0.00 | |
| 1–17 | South America | 11.3 | 6.3 | <5 | <5 | 0.00 | 0.00 | |
| 1–17 | South America | <5 | <5 | <5 | <5 | 0.00 | 0.00 | |
| 1–17 | Asia | 13.6 | 9.5 | <5 | <5 | 0.00 | 0.00 | |
| 1–17 | North America | 6.1 | <5 | <5 | <5 | 0.00 | 0.00 | |
| 1–17 | Europe | <5 | <5 | <5 | <5 | 0.00 | 0.00 | |
| 1–17 | North America | <5 | <5 | <5 | <5 | 0.00 | 0.00 | |
| 1–17 | Europe | 5.9 | <5 | <5 | <5 | 0.00 | 0.00 | |
| 1–17 | Asia | <5 | <5 | <5 | <5 | 0.00 | 0.00 | |
| 1–17 | Europe | 7.0 | <5 | <5 | <5 | 0.00 | 0.00 | |
| 1–17 | Europe | 6.1 | <5 | <5 | <5 | 0.00 | 0.00 | |
| 1–17 | Europe | — | 5.5 | <5 | <5 | 0.00 | 0.00 | |
| 1–17 | Europe | 8.0 | 5.5 | <5 | <5 | 0.00 | 0.00 | |
| 1–17 | Europe | 10.1 | 6.3 | <5 | <5 | 0.00 | 0.00 | |
| 1–17 | Europe | 13.0 | <5 | <5 | <5 | 0.00 | 0.00 | |
| 1–17 | South America | 7.5 | 6.8 | 5.0 | <5 | 0.00 | 0.00 | |
| 18 | Europe | 7.5 | 7.7 |
6.7 | 5.2 | 0.77 | 10.90 | |
| 18 | 10.0 | 6.8 | 6.0 | 5.2 | 1.60 | 19.03 | ||
| 20 | South America | 6.3 | 5.6 | 5.2 | 5.3 |
0.33 | 5.44 | |
| 21 | Asia | 11.4 | 12.3 |
8.1 | 5.4 | 2.00 | 19.86 | |
| 22 | Europe | 8.2 | 7.3 | 7.8 |
5.5 | 0.90 | 11.20 | |
| 23 | Africa | 10.3 | 7.8 | 7.0 | 5.7 | 1.53 | 17.70 | |
| 24 | Europe | 20.7 | 15.8 | 8.5 | 5.9 | 4.93 | 33.49 | |
| 25 | Asia | 25.0 | 16.0 | 10.6 | 6.1 | 6.30 | 37.40 | |
| 26 | Asia | 12.3 | 8.9 | <5 | 6.1 | 0.00 | 0.00 | |
| 27 | Europe | 6.5 | 5.9 | <5 | 6.4 | 0.00 | 0.00 | |
| 28 | Europe | — | 6.1 | 5.3 | 6.6 |
0.00 | 0.00 | |
| 28 | North America | 11.1 | 11.4 |
11.8 |
6.6 | 1.50 | 12.62 | |
| 30 | Asia | 24.4 | 16.9 | 12.7 | 6.7 | 5.90 | 34.28 | |
| 31 | Europe | 19.4 | 13.4 | 10.4 | 6.9 | 4.17 | 28.99 | |
| 32 | North America | 15.2 | 13.9 | 10.3 | 7.1 | 2.70 | 21.84 | |
| 33 | North America | 18.5 | 15.0 | 9.8 | 7.2 | 3.77 | 26.71 | |
| 34 | South America | 20.8 | 16.5 | 8.9 | 7.3 | 4.50 | 28.24 | |
| 35 | South America | 10.9 | 11.5 |
9.1 | 7.5 | 1.13 | 10.98 | |
| 35 | South America | 12.1 | 11.6 | 9.6 | 7.5 | 1.53 | 14.42 | |
| 35 | Asia | 11.1 | 12.2 |
8.2 | 7.5 | 1.20 | 10.47 | |
| 38 | North America | 10.1 | 8.4 | 7.4 | 7.7 |
0.80 | 8.23 | |
| 39 | Asia | 13.5 | 8.9 | 7.6 | 7.9 |
1.87 | 14.91 | |
| 40 | Oceania | 9.6 | 9.1 | 8.1 | 8.0 | 0.53 | 5.81 | |
| 41 | North America | 8.6 | 9.0 |
9.2 |
8.1 | 0.17 | 1.69 | |
| 42 | 18.4 | 13.9 | 11.7 | 8.4 | 3.33 | 22.83 | ||
| 43 | Asia | 10.8 | 8.1 | 8.6 |
8.8 |
0.67 | 5.50 | |
| 44 | Asia | 11.6 | 13.3 |
12.4 | 8.9 | 0.90 | 6.78 | |
| 44 | Africa | 15.5 | 17.5 |
9.6 | 8.9 | 2.20 | 13.18 | |
| 46 | Africa | 14.5 | 11.7 | 9.0 | 9.0 | 1.83 | 14.13 | |
| 47 | Africa | 15.0 | 13.6 | 12.3 | 9.3 | 1.90 | 14.43 | |
| * | Europe | — | — | — | 9-9.9* | 0.00 | 0.00 | |
| 48 | South America | 15.5 | 11.7 | 10.5 | 10.2 | 1.77 | 12.54 | |
| 48 | Asia | 17.8 | 12.3 | 12.7 |
10.2 | 2.53 | 15.78 | |
| 50 | North America | 14.7 | 12.1 | 10.4 | 10.5 |
1.40 | 10.26 | |
| 51 | South America | 19.7 | 19.0 | 16.3 | 11.0 | 2.90 | 16.76 | |
| 52 | South America | 17.3 | 15.8 | 12.2 | 11.1 | 2.07 | 13.49 | |
| 52 | Asia | 21.2 | 16.6 | 13.6 | 11.1 | 3.37 | 19.38 | |
| 54 | Africa | 16.4 | 14.4 | 15.3 |
11.9 | 1.50 | 9.39 | |
| 55 | Asia | 14.8 | 16.0 |
11.6 | 12.2 |
0.87 | 4.74 | |
| 56 | North America | 21.9 | 19.7 | 16.9 | 13.1 | 2.93 | 15.58 | |
| 56 | Asia | 30.1 | 23.2 | 12.7 | 13.1 |
5.67 | 21.68 | |
| 58 | North America | 22.3 | 17.1 | 14.6 | 13.2 | 3.03 | 15.84 | |
| 59 | Asia | 15.5 | 13.3 | 11.8 | 13.3 |
0.73 | 4.25 | |
| 60 | Africa | 18.4 | 19.4 |
15.3 | 13.5 | 1.63 | 9.15 | |
| 61 | 26.3 | 21.9 | 16.5 | 13.6 | 4.23 | 19.65 | ||
| 62 | South America | 27.6 | 23.2 | 16.8 | 14.0 | 4.53 | 20.06 | |
| 63 | Africa | 28.5 | 22.2 | 17.9 | 15.2 | 4.43 | 18.85 | |
| 64 | Asia | 21.9 | 19.5 | 20.1 |
16.3 | 1.87 | 8.93 | |
| 65 | Asia | 24.0 | 24.0 | 21.1 | 17.1 | 2.30 | 10.35 | |
| 65 | Africa | 34.3 | 24.4 | 18.0 | 17.1 | 5.73 | 20.03 | |
| 67 | Africa | 29.2 | 28.0 | 22.7 | 17.8 | 3.80 | 14.87 | |
| 68 | Africa | 21.1 | 20.4 | 18.8 | 18.2 | 0.97 | 4.78 | |
| 69 | Asia | 25.0 | 20.4 | 20.4 | 19.0 | 2.00 | 8.42 | |
| 70 | Africa | 36.4 | 31.0 | 23.2 | 19.1 | 5.77 | 19.22 | |
| 70 | Asia | 26.1 | 29.5 |
23.1 | 19.1 | 2.33 | 8.66 | |
| 70 | Africa | 25.3 | 24.7 | 23.9 | 19.1 | 2.07 | 8.56 | |
| 73 | Asia | 37.4 | 31.0 | 22.8 | 19.5 | 5.97 | 19.35 | |
| 74 | Africa | 26.1 | 24.1 | 17.8 | 20.3 |
1.93 | 6.59 | |
| 75 | Asia | 34.1 | 29.0 | 27.8 | 20.4 | 4.57 | 15.24 | |
| 76 | Asia | 41.2 | 27.2 | 24.9 | 20.6 | 6.87 | 19.90 | |
| 77 | North America | 28.5 | 24.6 | 22.2 | 20.7 | 2.60 | 10.07 | |
| 78 | Asia | 39.8 | 31.8 | 23.3 | 20.9 | 6.30 | 19.04 | |
| 79 | Africa | 34.1 | 28.7 | 24.2 | 22.4 | 3.90 | 12.98 | |
| 80 | Africa | 28.2 | 27.3 | 22.4 | 22.6 |
1.87 | 6.75 | |
| 80 | Africa | 43.2 | 33.8 | 27.1 | 22.6 | 6.87 | 19.40 | |
| 82 | Africa | 41.9 | 37.0 | 31.3 | 22.9 | 6.33 | 17.98 | |
| 83 | South America | 14.7 | 11.2 | 7.6 | 23.5 |
−2.93 | −51.09 | |
| 84 | Africa | 37.4 | 31.4 | 23.2 | 23.7 |
4.57 | 13.33 | |
| 85 | Africa | 32.0 | 29.0 | 23.7 | 24.0 |
2.67 | 8.80 | |
| 86 | Africa | 39.3 | 36.7 | 26.6 | 24.1 | 5.07 | 14.51 | |
| 87 | Africa | 33.6 | 34.7 |
30.1 | 24.5 | 3.03 | 9.53 | |
| 88 | Asia | 37.2 | 33.5 | 32.8 | 24.6 | 4.20 | 12.35 | |
| 89 | Africa | 40.8 | 33.6 | 30.0 | 25.0 | 5.27 | 15.01 | |
| 90 | Africa | 45.7 | 46.3 |
31.1 | 25.8 | 6.63 | 16.19 | |
| 91 | 33.8 | 34.7 |
27.8 | 26.0 | 2.60 | 7.90 | ||
| 92 | Africa | 43.7 | 43.6 | 35.5 | 26.2 | 5.83 | 15.00 | |
| 93 | Africa | 46.9 | 47.0 |
35.9 | 26.8 | 6.70 | 16.25 | |
| 94 | Asia | 38.9 | 37.5 | 29.3 | 27.2 | 3.90 | 10.88 | |
| 94 | Africa | — | — | 32.5 | 27.2 | 0.00 | 0.00 | |
| 96 | Asia | 39.5 | 33.1 | 28.2 | 27.5 | 4.00 | 11.16 | |
| 97 | Africa | 49.7 | 38.1 | 26.0 | 28.3 |
7.13 | 15.42 | |
| 98 | Africa | 40.6 | 34.1 | 32.0 | 29.2 | 3.80 | 10.31 | |
| 99 | Asia | 51.0 | 42.8 | 33.8 | 30.3 | 6.90 | 15.82 | |
| 100 | Africa | 36.0 | 30.4 | 24.6 | 30.7 |
1.77 | 3.28 | |
| 101 | Africa | 58.3 | 53.3 | 42.4 | 30.9 | 9.13 | 18.72 | |
| 102 | Africa | 48.0 | 40.0 | 33.1 | 31.4 | 5.53 | 13.02 | |
| 103 | Africa | 48.1 | 38.4 | 31.4 | 33.1 |
5.00 | 10.99 | |
| 104 | North America | 41.9 | 43.6 |
35.9 | 33.5 | 2.80 | 6.76 | |
| * | Africa | — | — | — | 20-34.9* | 0.00 | 0.00 | |
| * | Africa | — | — | — | 20-34.9* | 0.00 | 0.00 | |
| * | Africa | — | — | — | 20-34.9* | 0.00 | 0.00 | |
| * | Asia | — | — | — | 20-34.9* | 0.00 | 0.00 | |
| * | Africa | — | — | — | 20-34.9* | 0.00 | 0.00 | |
| * | Asia | — | — | — | 20-34.9* | 0.00 | 0.00 | |
| * | Africa | — | — | — | 20-34.9* | 0.00 | 0.00 | |
| * | Africa | — | — | — | 20-34.9* | 0.00 | 0.00 | |
| * | Africa | — | — | — | 20-34.9* | 0.00 | 0.00 | |
| 105 | Africa | 42.7 | 41.4 | 34.6 | 36.0 |
2.23 | 5.14 | |
| 106 | Asia | — | 46.1 | 36.2 | 37.6 |
0.00 | 0.00 | |
| 107 | Asia | 50.9 | 51.3 |
47.9 | 44.7 | 2.07 | 4.17 | |
| * | Africa | — | — | 35-49.9* | 0.00 | 0.00 | ||
| * | Africa | — | — | 35-49.9* | 0.00 | 0.00 | ||
| * | Africa | — | — | 35-49.9* | 0.00 | 0.00 | ||
| * | Africa | — | — | 35-49.9* | 0.00 | 0.00 | ||
| * | Africa | — | — | 35-49.9* | 0.00 | 0.00 | ||
| * | Africa | — | — | 35-49.9* | 0.00 | 0.00 | ||
| * | Asia | — | — | 35-49.9* | 0.00 | 0.00 | ||
| * | Asia | — | — | 35-49.9* | 0.00 | 0.00 | ||
— = Data are not available or not presented. Some countries did not exist in their present borders in the given year or reference period.
Notes: Rankings and index scores from this table cannot be accurately compared with rankings and index scores from previous GHI reports (see Appendix A of the full 2020 GHI report). For the 2020 GHI report, data were assessed for 132 countries. Out of these, there were sufficient data to calculate 2020 GHI scores for and rank 107 countries (by way of comparison, data availability allowed for the ranking of 117 countries in the 2019 report). For 25 countries, individual scores could not be calculated and ranks could not be determined owing to lack of data. Where possible, these countries were provisionally designated by severity: 1 country is designated as low, 9 as serious, and 8 as alarming. For 7 countries, no provisional designations could be established (see Box 1.3 in the 2020 GHI report).
* For 25 countries,individual scores could not be calculated and ranks could not be determined owing to lack of data. Where possible, these countries were provisionally designated by severity: 1 country is designated as "low", 9 as "serious", and 8 as "alarming". For 7 countries, no provisional designations could be established.
a Ranked according to 2020 GHI scores. Countries that have identical 2020 scores are given the same ranking (for example, North Macedonia and the Russian Federation are both ranked 18th).
b The 17 countries with 2020 GHI scores of less than 5 are not assigned individual ranks, but rather are collectively ranked 1–17. Differences between their scores are minimal.
Focus of the 2020 GHI: One Decade to Zero Hunger: Linking Health and Sustainable Food Systems
The events of 2020 are laying bare many of the vulnerabilities of the world’s food system in ways that are becoming impossible to ignore. However, by taking an integrated approach to health and food and nutrition security, it may yet be possible to achieve Zero Hunger by 2030. A One Health approach, which is based on a recognition of the interconnections between humans, animals, plants, and their shared environment, as well as the role of fair trade relations, would address the various crises we face holistically and help avert future health crises, restore a healthy planet, and end hunger.
A One Health lens brings into focus a number of weaknesses including the fragility of globalized food systems; underinvestment in local farmers, farmer associations, and smallholder-oriented value chains; increasing rates of diet-related noncommunicable disease; emergency responses that disrupt local food systems; the heavy environmental cost of food systems; inadequate social protection for much of the world’s population; unfair global food governance, including unjust trade and aid policies; and lack of secure land tenure, which results in food insecurity for rural communities, indigenous people, women, and marginalized groups.
To ensure the right to adequate and nutritious food for all and achieve Zero Hunger by 2030, we must approach health and food and nutrition security in a way that considers human, animal, and environmental health and fair trade relations holistically. Multilateral institutions, governments, communities, and individuals must take a number of actions in the short and long term, including sustaining the production and supply of food; ensuring social protection measures; strengthening regional food supply chains; reviewing food, health, and economic systems through a One Health lens to chart a path to environmental recovery; and working toward a circular food economy that recycles nutrients and materials, regenerates natural systems, and eliminates waste and pollution.
Focus of the 2019 GHI: The Challenge of Hunger and Climate Change
The 2019 GHI report notes that climate change is making it ever more difficult to adequately and sustainably feed and nourish the human population. Climate change has direct and indirect negative impacts on food security and hunger through changes in food production and availability, access, quality, utilization, and stability of food systems. In addition, climate change can contribute to conflict, especially in vulnerable and food-insecure regions, creating a double vulnerability for communities, which are pushed beyond their ability to cope.
Furthermore, climate change raises four key inequities that play out at the interface of climate change and food security:
1. the degree of responsibility for causing climate change
2. the intergenerational impacts of climate change
3. the impacts of climate change on poorer people in the Global South
4. the ability and capacity to deal with climate change impacts
Current actions are inadequate for the scale of the threat that climate change poses to food security. Transformation—a fundamental change in the attributes of human and natural systems—is now recognized as central to climate-resilient development pathways that can achieve zero hunger. Individual and collective values and behaviors must push toward sustainability and a fairer balance of political, cultural, and institutional power in society.
Focus of the 2018 GHI: Forced Migration and Hunger
The 2018 Global Hunger Index (GHI) report—the 13th in the annual series—presents a multidimensional measure of national, regional, and global hunger by assigning a numerical score based on several aspects of hunger. It then ranks countries by GHI score and compares current scores with past results. The 2018 report shows that in many countries and in terms of the global average, hunger and undernutrition have declined since 2000; in some parts of the world, however, hunger and undernutrition persist or have even worsened. Since 2010, 16 countries have seen no change or an increase in their GHI levels.
The essay in the 2018 GHI report examines forced migration and hunger—two closely intertwined challenges that affect some of the poorest and most conflict-ridden regions of the world. Globally, there are an estimated 68.5 million displaced people, including 40.0 million internally displaced people, 25.4 million refugees, and 3.1 million asylum seekers. For these people, hunger may be both a cause and a consequence of forced migration.
Support for food-insecure displaced people needs to be improved in four key areas:
• recognizing and addressing hunger and displacement as political problems;
• adopting more holistic approaches to protracted displacement settings involving development support;
• providing support to food-insecure displaced people in their regions of origin; and
• recognizing that the resilience of displaced people is never entirely absent and should be the basis for providing support.
The 2018 Global Hunger Index report presents recommendations for providing a more effective and holistic response to forced migration and hunger. These include focusing on those countries and groups of people who need the most support, providing long-term solutions for displaced people, and engaging in greater responsibility sharing at an international level.
Focus of the 2017 GHI: The Inequalities of Hunger
The 2017 highlights the uneven nature of progress made in reducing hunger worldwide and the ways in which inequalities of power lead to unequal nourishment.
Achieving the UN Sustainable Development Goals’ aim of “leaving no one behind” demands approaches to hunger and malnutrition that are both more sensitive to their uneven distribution and more attuned to the power inequalities that intensify the effects of poverty and marginalization on malnutrition. The report emphasizes the importance of using power analysis to name all forms of power that keep people hungry and malnourished; the significance of designing interventions strategically focused on where power is exerted; the need to empower the hungry and malnourished to challenge and resist loss of control over the food they eat.
Focus of the 2016 GHI: Getting to Zero Hunger
The 2016 Global Hunger Index (GHI) presents a multidimensional measure of national, regional, and global hunger, focusing on how the world can get to Zero Hunger by 2030.
The developing world has made substantial progress in reducing hunger since 2000. The 2016 GHI shows that the level of hunger in developing countries as a group has fallen by 29 percent. Yet this progress has been uneven, and great disparities in hunger continue to exist at the regional, national, and subnational levels.
The 2016 GHI emphasizes that the regions, countries, and populations most vulnerable to hunger and undernutrition have to be identified, so improvement can be targeted there, if the world community wants to seriously Sustainable Development Goal 2 on ending hunger and achieving food security.[GHI2016 2]
Focus of the 2015 GHI: Armed Conflict and Chronic Hunger
The chapter on hunger and conflict shows that the time of great famines with more than 1 million people dead is over. There is, however, a clear connection between armed conflict and severe hunger. Most of the countries scoring worst in the 2015 GHI are experiencing or have recently experienced armed conflict. Still, severe hunger also exists without conflict present, as the cases of several countries in South Asia and Africa show.
Armed conflict has increased since 2005, and unless it can be reduced, there is little hope for eliminating hunger.[GHI2015 1]
Focus of the 2014 GHI: Hidden Hunger
Hidden hunger concerns over 200 million people worldwide. This micronutrient deficiency develops when humans do not take in enough micronutrients such as zinc, folate, iron and vitamins, or when their bodies cannot absorb them. Reasons include an unbalanced diet, a higher need for micronutrients (e.g. during pregnancy or while breast feeding) but also health issues related to sickness, infections or parasites.
The consequences for individuals can be devastating: these often include mental impairment, bad health, low productivity and death caused by sickness. In particular, children are affected if they do not absorb enough micronutrients in the first 1000 days of their lives (beginning with conception).[GHI2014 1]
Micronutrient deficiencies are responsible for an estimated 1.1 million of the yearly 3.1 million death caused by undernutrition in children. Despite the magnitude of the problem, it is still not easy to get precise data on the spread of hidden hunger. Macronutrient and micronutrient deficiencies cause a loss in global productivity of 1.4 to 2.1 billion US Dollars per year.[35]
Different measures exist to prevent hidden hunger. It is essential to ensure that humans maintain a diverse diet. The quality of produce is as important as the caloric input. This can be achieved by promoting the production of a wide variety of nutrient-rich plants and the creation of house gardens.
Other possible solutions are the industrial enrichment of food or biofortification of feedplants (e.g. vitamin A rich sweet potatoes). In the case of acute nutrient deficiency and in specific life phases, food supplements can be used. In particular, the addition of vitamin A leads to a better child survival rate.[GHI2014 2]
Generally, the situation concerning hidden hunger can only be improved when many measures intermesh. In addition to the direct measures described above, this includes the education and empowerment of women, the creation of better sanitation and adequate hygiene, and access to clean drinking water and health services.
Focus of the 2013 GHI: Resilience to Build Food and Nutrition Security
Many of the countries in which the hunger situation is "alarming" or "extremely alarming" are particularly prone to crises: In the African Sahel people experience yearly droughts. On top of that, they have to deal with violent conflict and natural calamities. At the same time, the global context becomes more and more volatile (financial and economic crises, food price crises).
The inability to cope with these crises leads to the destruction of many development successes that had been achieved over the years. In addition, people have even less resources to withstand the next shock or crises. 2.6 billion people in the world live on less than US$2 per day. For them, a sickness in the family, crop failure after a drought, or the interruption of remittances from relatives who live abroad can set in motion a downward spiral from which they cannot free themselves on their own.
It is therefore not enough to support people in emergencies and, once the crisis is over, to start longer-term development efforts. Instead, emergency and development assistance has to be conceptualized with the goal of increasing resilience of poor people against these shocks.
The Global Hunger Index differentiates three coping strategies. The lower the intensity of the crises, the less resources have to be used to cope with the consequences:[GHI2013 1]
- Absorption: Skills or resources are used to reduce the impact of a crisis without changing a household's lifestyle (e.g., selling some livestock).
- Adaptation: Once the capacity to absorb is exhausted, steps are taken to adapt the household's lifestyle to the situation without making drastic changes (e.g., using drought-resistant seeds).
- Transformation: If adaptation strategies do not suffice to deal with the negative impact of the crisis, fundamental, longer-lasting changes to life and behavior have to be made (e.g., nomadic tribes become sedentary farmers because they cannot keep their herds).
Based on this analysis, the authors present several policy recommendations: [GHI2013 2]
- Overcoming the institutional, financial, and conceptual boundaries between humanitarian aid and development assistance.
- Elimination of policies that undermine people's resilience. Using the Right to Food as a basis for the development of new policies.
- Implementation of multi-year, flexible programs, which are financed in a way that enables multisectoral approaches to overcome chronic food crises.
- Communicating that improving resilience is cost-effective and improves food and nutrition security, especially in fragile contexts.
- Scientific monitoring and evaluation of measures and programs with the goal to increase resilience.
- Active involvement of the local population in the planning and implementation of resilience-increasing programs.
- Improvement of food, especially of mothers and children, through nutrition-specific and nutrition-sensitive interventions to prevent short-term crises from leading to nutrition-related problems late in life or across generations.
Focus of the 2012 GHI: Pressures on Land, Water, and Energy Resources
Increasingly, hunger is related to how we use land, water, and energy. The growing scarcity of these resources puts more and more pressure on food security. Several factors contribute to an increasing shortage of natural resources:[GHI2012 1]
- Demographic change: The world population is expected to be over 9 billion by 2050. Additionally, more and more people live in cities. Urban populations feed themselves differently than inhabitants of rural areas; they tend to consume less staple foods and more meat and dairy products.
- Higher income and non-sustainable use of resources: As the global economy grows, wealthy people consume more food and goods, which have to be produced with a lot of water and energy. They can afford not to be efficient and wasteful in their use of resources.
- Bad policies and weak institutions: When policies, for example energy policy, are not tested for the consequences they have on the availability of land and water it can lead to failures. An example are the biofuel policies of industrialized countries: As corn and sugar are increasingly used for the production of fuels, there is less land and water for the production of food.
Signs for an increasing scarcity of energy, land and water resources are for example: growing prices for food and energy, a massive increase of large-scale investment in arable land (so-called land grabbing), increasing degradation of arable land because of too intensive land use (for example, increasing desertification), increasing number of people, who live in regions with lowering ground water levels, and the loss of arable land as a consequence of climate change.
The analysis of the global conditions lead the authors of the GHI 2012 to recommend several policy actions:[36]
- Securing land and water rights
- Gradual lowering of subsidies
- Creation of a positive macroeconomic framework
- Investment in agriculture technology development to promote a more efficient use of land, water and energy
- Support for approaches, that lead to a more efficient use of land, water and energy along the whole value chain
- Preventing and overuse of natural resources through monitoring strategies for water, land and energy, and agricultural systems
- Improvement of the access to education for women and the strengthening of their reproductive rights to address demographic change
- Increase incomes, reduce social and economic inequality and promotion of sustainable lifestyles
- Climate change mitigation and adaptation through a reorientation of agriculture
Focus of the 2011 GHI: Rising and Volatile Food Prices
The report cites 3 factors as the main reasons for high volatility, or price changes, and price spikes of food:
- Use of the so-called biofuels, promoted by high oil prices, subsidies in the United States (over one third of the corn harvest of 2009 and 2010 respectively) and quota for biofuel in gasoline in the European Union, India and others.
- Extreme weather events as a result of Climate Change
- Future trading of agricultural commodities, for instance investments in fonds, which are speculating on price changes of agricultural products (2003: 13 Bn US Dollar, 2008: 260 Bn US Dollar), as well as increasing trade volume of these goods.
Volatility and prices increases are worsened according to the report by the concentration of staple foods in a few countries and export restrictions of these goods, the historical low of worldwide cereal reserves and the lack of timely information on food products, reserves and price developments. Especially this lack of information can lead to overreactions in the markets. Moreover, seasonal limitations on production possibilities, limited land for agricultural production, limited access to fertilizers and water, as well as the increasing demand resulting from population growth, puts pressure on food prices.
According to the Global Hunger Index 2011 price trends show especially harsh consequences for poor and under-nourished people, because they are not capable to react to price spikes and price changes. Reactions, following these developments, can include: reduced calorie intake, no longer sending children to school, riskier income generation such as prostitution, criminality, or searching landfills, and sending away household members, who cannot be fed anymore. In addition, the report sees an all-time high in the instability and unpredictability of food prices, which after decades of slight decrease, increasingly show price spikes (strong and short-term increase).[GHI2011 1][GHI2011 2]
At a national level, especially food importing countries (those with a negative food trade balance, are affected by the changing prices.
Focus of the 2010 GHI: Early Childhood Undernutrition
Undernutrition among children has reached terrible levels. About 195 million children under the age of five in the developing world—about one in three children—are too small and thus underdeveloped. Nearly one in four children under age five—129 million—is underweight, and one in 10 is severely underweight. The problem of child undernutrition is concentrated in a few countries and regions, with more than 90 percent of stunted children living in Africa and Asia. 42% of the world's undernourished children live in India alone.
The evidence presented in the report[37][38] shows that the window of opportunity for improving nutrition spans is the 1,000 days between conception and a child's second birthday (that is the period from -9 to +24 months). Children who are do not receive adequate nutrition during this period have increased risks to experiencing lifelong damage, including poor physical and cognitive development, poor health, and even early death. The consequences of malnutrition that occurred after 24 months of a child's life are by contrast largely reversible.[39]
References
- 2019 GHI: Chapter 1
- Global Hunger Index. "Global Hunger Index and the Paradox of Hunger". Human Rights & the Global Economy eJournal. Social Science Research Network (SSRN).
- IFPRI/ Welthungerhilfe: The Challenge of Hunger − Global Hunger Index: Facts, determinants, and trends. Case studies of post conflict countries of Afghanistan and Sierra Leone". Bonn, October 2006.
- IFPRI/ Concern/ Welthungerhilfe: The Challenge of Hunger 2007 − Global Hunger Index: Facts, determinants, and trends 2007. "Measures being taken to reduce acute undernourishment and chronic hunger". Bonn, October 2007.
- IFPRI/ Concern/ Welthungerhilfe: Global Hunger Index − The Challenge of Hunger 2008. Bonn, Washington D.C., Dublin. October 2008.
- IFPRI/ Concern/ Welthungerhilfe: 2009 Global Hunger Index − The Challenge of Hunger: Focus on Financial Crisis and Gender Inequality. Bonn, Washington D. C., Dublin. October 2009.
- IFPRI/ Concern/ Welthungerhilfe: 2010 Global Hunger Index The challenge of hunger: Focus on the crisis of child undernutrition. Bonn, Washington D. C., Dublin. October 2011.
- IFPRI/ Concern/ Welthungerhilfe: 2011 Global Hunger Index - The challenge of hunger: Taming Price Spikes and Excessive Food Price Volatility. Bonn, Washington D. C., Dublin. October 2011.
- IFPRI/ Concern/ Welthungerhilfe: 2012 Global Hunger Index - The challenge of hunger: Ensuring sustainable food security under land, water, and energy stresses. Bonn, Washington D. C., Dublin. October 2012.
- Welthungerhilfe, IFPRI, and Concern Worldwide: 2013 Global Hunger Index - The challenge of hunger: Building Resilience to Achieve Food and Nutrition Security. Bonn, Washington D. C., Dublin. October 2013.
- Welthungerhilfe, IFPRI, and Concern Worldwide: 2014 Global Hunger Index - The challenge of hidden hunger. Bonn, Washington D. C., Dublin. October 2014.
- K. von Grebmer, J. Bernstein, A. de Waal, N. Prasai, S. Yin, Y. Yohannes: 2015 Global Hunger Index - Armed Conflict and the Challenge of Hunger. Bonn, Washington D. C., Dublin: Welthungerhilfe, IFPRI, and Concern Worldwide. October 2015.
- von Grebmer, Klaus; Bernstein, Jill; Nabarro, David; Prasai, Nilam; Amin, Shazia; Yohannes, Yisehac; Sonntag, Andrea; Patterson, Fraser; Towey, Olive; and Thompson, Jennifer. 2016 Global hunger index: Getting to zero hunger. Bonn; Washington, D.C.; and Dublin: Welthungerhilfe; International Food Policy Research Institute; and Concern Worldwide.
- K. von Grebmer, J. Bernstein, N. Hossain, T. Brown, N. Prasai, Y. Yohannes, F. Patterson, A. Sonntag, S.-M. Zimmermann, O. Towey, C. Foley. 2017. 2017 Global Hunger Index: The Inequalities of Hunger. Washington, D.C.: International Food Policy Research Institute; Bonn: Welthungerhilfe; and Dublin: Concern Worldwide.
- K. von Grebmer, J. Bernstein, L. Hammond, F. Patterson, A. Sonntag, L. Klaus, J. Fahlbusch, O. Towey, C. Foley, S. Gitter, K. Ekstrom, and H. Fritschel. 2018. 2018 Global Hunger Index: Forced Migration and Hunger. Bonn and Dublin: Welthungerhilfe and Concern Worldwide.
- K. von Grebmer, J. Bernstein, R. Mukerji, F. Patterson, M. Wiemers, R. Ní Chéilleachair, C. Foley, S. Gitter, K. Ekstrom, and H. Fritschel. 2019. 2019 Global Hunger Index: The Challenge of Hunger and Climate Change. Bonn: Welthungerhilfe; and Dublin: Concern Worldwide.
- "About: The Concept of the Global Hunger Index", Global Hunger Index
- von Grebmer, Klaus; Bernstein, Jill; Hossain, Naomi; Brown, Tracy; Prasai, Nilam; Yohannes, Yisehac; Patterson, Fraser; Sonntag, Andrea; Zimmermann, Sophia-Marie; Towey, Olive; and Foley, Connell. 2017. 2017 "Global Hunger Index: The inequalities of hunger: Synopsis". Washington, D.C.; Bonn; and Dublin: International Food Policy Research Institute, Welthungerhilfe, and Concern Worldwide.
- FAO (Food and Agriculture Organization of the United Nations). 2016. "Food Security Indicators" ((Updated February 9, 2016). . Rome.
- UN IGME (UN Inter-agency Group for Child Mortality Estimation). 2015. "Child Mortality Estimates: Info, Under-five Mortality Estimates". (Updated September 9, 2015). .
- K. von Grebmer, J. Bernstein, A. de Waal, N. Prasai, S. Yin, Y. Yohannes: 2015 Global Hunger Index - Armed Conflict and the Challenge of Hunger. Bonn, Washington D. C., Dublin: Welthungerhilfe, IFPRI, and Concern Worldwide. October 2015.
- K. von Grebmer, M. Torero, T. Olofinbiyi, H. Fritschel, D. Wiesmann, Y. Yohannes, L. Schofield, C. von Oppeln. 2011 Global Hunger Index - The Challenge of Hunger: Taming Price Spikes and Excessive Food Price Volatility. Bonn, Washington, D.C., Dublin: IFRPI, Welthungerhilfe and Concern Worldwide.
- Food and Agriculture Organization of the United Nations. 2013 The State of Food and Agriculture: Food Systems for Better Nutrition. Rome.
- Victora, C. G., L. Adair, C. Fall, P. C. Hallal, R. Martorell, L. Richter und H. Singh Sachdev for the Maternal and Child Undernutrition Study Group. 2008. "Maternal and child undernutrition: Consequences for adult health and human capital". The Lancet 371 (9609): 340–57
- Victora, C. G., M. de Onis, P. C. Hallal, M. Blössner und R. Shrimpton. 2010. "Worldwide timing of growth faltering: Revisiting implications for interventions". Pediatrics 125 (3): 473.
- IFPRI/ Concern/ Welthungerhilfe: 2010 Global Hunger Index The challenge of hunger: Focus on the crisis of child undernutrition. Bonn, Washington D. C., Dublin. October 2011.
- K. von Grebmer, J. Bernstein, D. Nabarro, N. Prasai, S. Amin, Y. Yohannes, A. Sonntag, F. Patterson, O. Towey, and J. Thompson. 2016. 2016 Global Hunger Index: Getting to Zero Hunger. Bonn, Washington, D.C., and Dublin: Welthungerhilfe, International Food Policy Research Institute, and Concern Worldwide.
- K. von Grebmer, J. Bernstein, N. Hossain, T. Brown, N. Prasai, Y. Yohannes, F. Patterson, A. Sonntag, S.-M. Zimmermann, O. Towey, C. Foley. 2017. 2017 Global Hunger Index: The Inequalities of Hunger. Washington, D.C.: International Food Policy Research Institute; Bonn: Welthungerhilfe; and Dublin: Concern Worldwide.
- K. von Grebmer, J. Bernstein, L. Hammond, F. Patterson, A. Sonntag, L. Klaus, J. Fahlbusch, O. Towey, C. Foley, S. Gitter, K. Ekstrom, and H. Fritschel. 2018. 2018 Global Hunger Index: Forced Migration and Hunger. Bonn and Dublin: Welthungerhilfe and Concern Worldwide.
- K. von Grebmer, J. Bernstein, R. Mukerji, F. Patterson, M. Wiemers, R. Ní Chéilleachair, C. Foley, S. Gitter, K. Ekstrom, and H. Fritschel. 2019. 2019 Global Hunger Index: The Challenge of Hunger and Climate Change. Bonn: Welthungerhilfe; and Dublin: Concern Worldwide.
- "Compact2025: Ending hunger and undernutrition". 2015. Project Paper. IFPRI: Washington, D.C.
- Citation error. See inline comment how to fix.
- von Grebmer, K., J. Bernstein, R. Alders, O. Dar, R. Kock, F. Rampa, M. Wiemers, K. Acheampong, A. Hanano, B. Higgins, R. Ní Chéilleachair, C. Foley, S. Gitter, K. Ekstrom, and H. Fritschel: 2020 Global Hunger Index - One Decade to Zero Hunger: Linking Health and Sustainable Food Systems
- https://www.globalhungerindex.org/results.html
- Food and Agriculture Organization of the United Nations. 2013 "The State of Food and Agriculture: Food Systems for Better Nutrition". Rome.
- IFPRI/ Welthungerhilfe/ Concern. 2012. 2012 Global Hunger Index. Issue Brief No. 70. Washington, D.C.
- Victora, C. G., L. Adair, C. Fall, P. C. Hallal, R. Martorell, L. Richter und H. Singh Sachdev for the Maternal and Child Undernutrition Study Group. 2008. "Maternal and child undernutrition: Consequences for adult health and human capital". The Lancet 371 (9609): 340–57
- Victora, C. G., M. de Onis, P. C. Hallal, M. Blössner und R. Shrimpton. 2010. "Worldwide timing of growth faltering: Revisiting implications for interventions". Pediatrics 125 (3): 473.
- IFPRI/ Concern/ Welthungerhilfe: 2010 Global Hunger Index The challenge of hunger: Focus on the crisis of child undernutrition. Bonn, Washington, D.C., Dublin. October 2011.
- K. von Grebmer, J. Bernstein, R. Alders, O. Dar, R. Kock, F. Rampa, M. Wiemers, K. Acheampong, A. Hanano, B. Higgins, R. Ní Chéilleachair, C. Foley, S. Gitter, K. Ekstrom, and H. Fritschel. 2020. 2020 Global Hunger Index: One Decade to Zero Hunger: Linking Health and Sustainable Food Systems. Bonn: Welthungerhilfe; and Dublin: Concern Worldwide.
- K. von Grebmer, J. Bernstein, R. Mukerji, F. Patterson, M. Wiemers, R. Ní Chéilleachair, C. Foley, S. Gitter, K. Ekstrom, and H. Fritschel. 2019. 2019 Global Hunger Index: The Challenge of Hunger and Climate Change. Bonn: Welthungerhilfe; and Dublin: Concern Worldwide.
- K. von Grebmer, J. Bernstein, L. Hammond, F. Patterson, A. Sonntag, L. Klaus, J. Fahlbusch, O. Towey, C. Foley, S. Gitter, K. Ekstrom, and H. Fritschel. 2018. 2018 Global Hunger Index: Forced Migration and Hunger. Bonn and Dublin: Welthungerhilfe and Concern Worldwide.
- K. von Grebmer, J. Bernstein, N. Hossain, T. Brown, N. Prasai, Y. Yohannes, F. Patterson, A. Sonntag, S.-M. Zimmermann, O. Towey, C. Foley. 2017. 2017 Global Hunger Index: The Inequalities of Hunger. Washington, D.C.: International Food Policy Research Institute; Bonn: Welthungerhilfe; and Dublin: Concern Worldwide.
- K. von Grebmer, J. Bernstein, D. Nabarro, N. Prasai, S. Amin, Y. Yohannes, A. Sonntag, F. Patterson, O. Towey, and J. Thompson. 2016. 2016 Global Hunger Index - Getting to Zero Hunger. Bonn, Washington, D.C., and Dublin: Welthungerhilfe, International Food Policy Research Institute, and Concern Worldwide.
- K. von Grebmer, J. Bernstein, A. de Waal, N. Prasai, S. Yin, Y. Yohannes: 2015 Global Hunger Index - Armed Conflict and the Challenge of Hunger. Bonn, Washington D. C., Dublin: Welthungerhilfe, IFPRI, and Concern Worldwide. October 2015.
- K. von Grebmer; A. Saltzman; E. Birol; D. Wiesmann; N. Prasai; S. Yin; Y. Yohannes; P. Menon; J. Thompson; A. Sonntag. 2014. 2014 Global Hunger Index: The challenge of hidden hunger. Bonn, Washington, D.C., and Dublin: Welthungerhilfe, IFPRI, and Concern Worldwide.
- Prasai, Nilam. 2014. "Global Hunger Index 2014: Interactive Tool" Web application created with Tableau software 8.2. Retrieved from http://www.ifpri.org/tools/2014-ghi-map (access date).
- von Grebmer, Klaus; Headey, Derek; Béné, Christophe; Haddad, Lawrence; Olofinbiyi, Tolulope; Wiesmann, Doris; Fritschel, Heidi; Yin, Sandra; Yohannes, Yisehac; Foley, Connell; von Oppeln, Constanze; and Iseli, Bettina. 2013. 2013 Global Hunger Index: The challenge of hunger: Building resilience to achieve food and nutrition security. Bonn, Washington, D.C., and Dublin: Welthungerhilfe, IFPRI, and Concern Worldwide.
- Klaus von Grebmer, Claudia Ringler, Mark W. Rosegrant, Tolulope Olofinbiyi, Doris Wiesmann, Heidi Fritschel, Ousmane Badiane, Maximo Torero, Yisehac Yohannes (IFPRI); Jennifer Thompson (Concern Worldwide); Constanze von Oppeln, Joseph Rahall (Welthungerhilfe and Green Scenery): 2012 Global Hunger Index - The challenge of hunger: Ensuring sustainable food security under land, water, and energy stresses. Washington, D.C. October 2012.
- "Chapter 3: Sustainable food security under land, water, and energy stresses", pages 25-26
- Klaus von Grebmer, Maximo Torero, Tolulope Olofinbiyi, Heidi Fritschel, Doris Wiesmann, Yisehac Yohannes (IFPRI); Lilly Schofield, Constanze von Oppeln (Concern Worldwide und Welthungerhilfe): 2011 Global Hunger Index - The challenge of hunger: Taming Price Spikes and Excessive Food Price Volatility. Bonn, Washington D. C., Dublin. October 2011.
- "Chapter 3: Combating Hunger in a World of High and Volatile Food Prices"
- "Chapter 4: The Impacts of Food Price Spikes and Volatility at Local Levels", pages 20–41
Further reading
- Alkire, S. und M. E. Santos. 2010. "Multidimensional Poverty Index: 2010 data". Oxford Poverty and Human Development Initiative.
- Wiesmann, Doris (2004): An international nutrition index: concept and analyses of food insecurity and undernutrition at country levels. Development Economics and Policy Series 39. Peter Lang Verlag.
External links
- "Data from the 2016 GHI"
- "2015 Global Hunger Index: Fact Sheet"
- "Global Hunger Index: Interactive Maps"
- "GHI 2014: Hunger in the shadows of the Millennium Development Goals". IFPRI Blog, 13 October 2014. Accessed on 20 October 2015.
- "2013 Global Hunger Index: The Challenge of Hunger: Building resilience to achieve food and nutrition security"
- "2012 Global Hunger Index: The Challenge of Hunger: Ensuring sustainable food security under land, water, and energy stresses"
- "2011 Global Hunger Index: The Challenge of Hunger: Taming price spikes and excessive food price volatility"
- "2010 Global Hunger Index: The Challenge of Hunger: Focus on the crisis of child undernutrition"
- "2009 Global Hunger Index: The Challenge of Hunger: Focus on Financial Crisis and Gender Inequality"
- "Welthungerhilfe Hunger Issue Page"
- "Concern Worldwide"
- "How are we doing on poverty and hunger reduction? A new measure of country performance"