Ioannina National Airport
Ioannina International Airport (Greek: Διεθνής Αερολιμένας Ιωαννίνων) (IATA: IOA, ICAO: LGIO) is an airport located four kilometers from the city center of Ioannina, Greece. Its full name is Ioannina International Airport - King Pyrrhus.

Ioannina International Airport "King Pyrros" Διεθνής Αερολιμένας Ιωαννίνων "Βασιλεύς Πύρρος" | |||||||||||
|---|---|---|---|---|---|---|---|---|---|---|---|
| Summary | |||||||||||
| Airport type | International | ||||||||||
| Owner | Greek State | ||||||||||
| Operator | HCAA | ||||||||||
| Serves | Ioannina | ||||||||||
| Location | Ioannina | ||||||||||
| Elevation AMSL | 1,558 ft / 475 m | ||||||||||
| Coordinates | 39°41′47″N 20°49′21″E | ||||||||||
| Map | |||||||||||
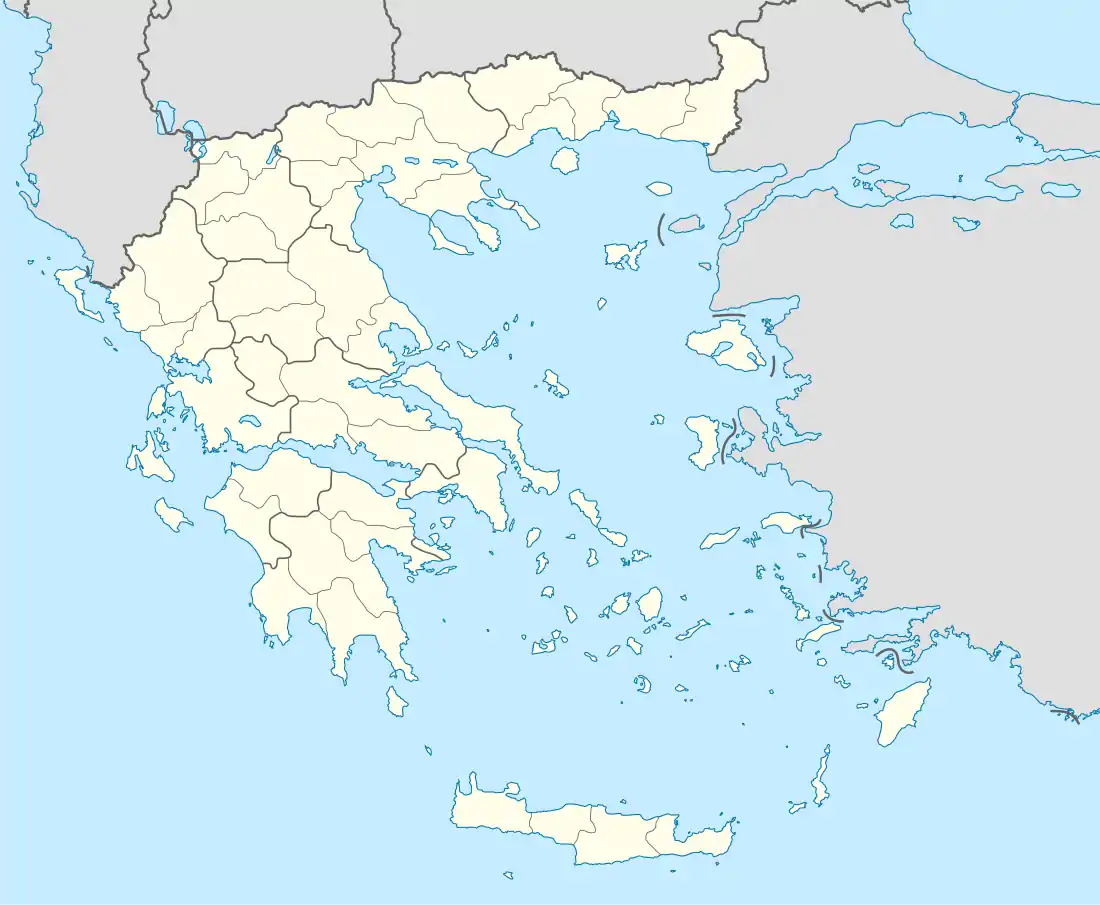
 IOA Location of airport in Greece | |||||||||||
| Runways | |||||||||||
| |||||||||||
| Statistics (2019) | |||||||||||
| |||||||||||
Statistics [1] | |||||||||||
History
The airport of Ioannina was established in 1932. The original 450m2 terminal building building was built in 1953 and then expanded to double the area in 1953 and by a further 600m2 in 1993. Airport was named "King Pyrros" in 2007. A new control tower and the new taxiway were completed in 2017.
On 11 July 2019 the new airport terminal was completed and commissioned. The new terminal includes a new departure and arrival hall and a waiting area for passengers as well as a restaurant and Duty-free area.
Airport facilities
The Runway has a length of 2.400 and a width 45 meters with three taxiways and a 43m2 apron. Fire Fighting capability is Category 6 (VI). The terminal has an area of 5,290m2.[2]
Airlines and destinations
| Airlines | Destinations |
|---|---|
| Aegean Airlines | Athens |
| Great Dane Airlines | Seasonal charter: Billund (begins 31 May 2021) |
| Olympic Air | Athens |
| Scandinavian Airlines | Seasonal charter: Copenhagen (begins 31 May 2021), Göteborg, Stockholm–Arlanda ( resumes 17 May 2021)[3] |
| Sky Express | Athens |
| Ukraine International Airlines | Seasonal charter: Kiev-Boryspil (resumes 19 June 2021)[4] |
| Widerøe | Seasonal charter: Oslo,[5] (resume 31 May 2021), Trondheim |
Traffic statistics
| Year | Flights total | Domestic passengers | International passengers | Total passengers | % Annual change total |
|---|---|---|---|---|---|
| 1994 | 1,648 | 79,844 | 218 | 80,062 | |
| 1995 | 1,935 | 95,994 | 114 | 96,108 | |
| 1996 | 2,101 | 110,165 | 775 | 110,940 | |
| 1997 | 1,946 | 108,745 | 48 | 108,793 | |
| 1998 | 1,975 | 107,410 | 4 | 107,414 | |
| 1999 | 2,198 | 119,196 | 227 | 119,423 | |
| 2000 | 3,492 | 175,240 | 611 | 175,851 | |
| 2001 | 3,352 | 146,888 | 74 | 146,962 | |
| 2002 | 2,981 | 125,894 | 0 | 125,894 | |
| 2003 | 2,757 | 135,206 | 402 | 135,608 | |
| 2004 | 2,936 | 145,602 | 445 | 146,047 | |
| 2005 | 2,618 | 128,100 | 1,298 | 129,398 | |
| 2006 | 2,172 | 125,731 | 508 | 126,239 | |
| 2007 | 2,308 | 138,104 | 2,770 | 140,874 | |
| 2008 | 2,186 | 129,939 | 973 | 130.912 | |
| 2009 | 2,428 | 137,253 | 729 | 137,982 | |
| 2010 | 2,190 | 119,329 | 695 | 120,024 | |
| 2011 | 1,620 | 88,271 | 326 | 88,597 | |
| 2012 | 1,364 | 70,937 | 254 | 71,191 | |
| 2013 | 1,180 | 64,479 | 10 | 64,489 | |
| 2014 | 1,198 | 79,389 | 6 | 79,395 | |
| 2015 | 1,338 | 86,515 | 8 | 86,523 | |
| 2016 | 1,426 | 97,105 | 17 | 97,122 | |
| 2017 | 1,394 | 89,858 | 6,492 | 95,585 | |
| 2018 | 1,598 | 89,096 | 19,836 | 108,932 | |
| 2019 | 2,146 | 104,109 | 26,235 | 130,344 | |
| 2020* | 908 | 36,856 | 5 | 36,856 |
- Jan-Dec
References
- "IOANNINA AIRPORT "KING PYRROS"". ypa.gr. Retrieved 24 Jan 2017.
- http://www.ypa.gr/our-airports/kratikos-aerolimenas-iwanninwn-basileys-pyrros-kaiwp
- "Flight". apollo.se.
- "Flight". feerie.com.ua/ru.
- "Flight". apollo.no.
- "Ioannina Airport".
- "Temporary Statistics".
External links
- Greek Airport Guide: Ioannina Airport
- Airport information for LGIO at World Aero Data. Data current as of October 2006.