Koblenz (electoral district)
Koblenz is an electoral constituency (German: Wahlkreis) represented in the Bundestag. It elects one member via first-past-the-post voting. Under the current constituency numbering system, it is designated as constituency 199. It is located in northern Rhineland-Palatinate, comprising the city of Koblenz, the eastern part of the Mayen-Koblenz district, and the western part of the Rhein-Lahn-Kreis district.[1]
| 199 Koblenz | |
|---|---|
| electoral district for the Bundestag | |
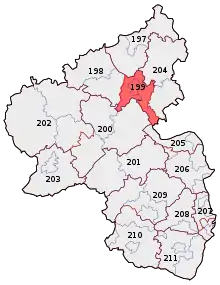 Koblenz in 2017 | |
| State | Rhineland-Palatinate |
| Population | 257,200 (2015) |
| Electorate | 196,999 (2017) |
| Major settlements | Koblenz Lahnstein Bendorf |
| Area | 635.0 km2 |
| Current electoral district | |
| Created | 1949 |
| Party | CDU |
| Member | Josef Oster |
| Elected | 2017 |
Koblenz was created for the inaugural 1949 federal election. Since 2017, it has been represented by Josef Oster of the Christian Democratic Union (CDU).[2]
Geography
Koblenz is located in northern Rhineland-Palatinate. As of the 2021 federal election, it comprises the independent city of Koblenz, the municipality of Bendorf and the Verbandsgemeinden of Rhein-Mosel, Vallendar, and Weißenthurm from the Mayen-Koblenz district, and, from the Rhein-Lahn-Kreis district, the municipality of Lahnstein, the Verbandsgemeinde of Loreley, and the muncipalities of Arzbach, Bad Ems, Becheln, Dausenau, Fachbach, Frücht, Kemmenau, Miellen, and Nievern from the Bad Ems-Nassau Verbandsgemeinde.[1]
History
Koblenz was created in 1949. In the 1949 election, it was Rhineland-Palatinate constituency 3 in the numbering system. In the 1953 through 1976 elections, it was number 150. In the 1980 through 1998 elections, it was number 148. In the 2002 election, it was number 202. In the 2005 election, it was number 201. In the 2009 and 2013 elections, it was number 200. Since the 2017 election, it has been number 199.
Originally, the constituency comprised the independent city of Koblenz and the districts of Landkreis Koblenz and Sankt Goar. In the 1972 through 1998 elections, it comprised the city of Koblenz, the municipality of Bendorf and the Verbandsgemeinden of Rhens, Untermosel, Vallendar, and Weißenthurm from the Mayen-Koblenz district, and the municipality of Boppard and the Verbandsgemeinden of Emmelshausen and Sankt Goar-Oberwesel from the Rhein-Hunsrück-Kreis district. It acquired its current borders in the 2002 election, although in 2014 the Verbandsgemeinde of Rhein-Mosel was created from Rhens and Untermosel, and the Verbandsgemeinde of Loreley absorbed Braubach.
| Election | No. | Name | Borders |
|---|---|---|---|
| 1949 | 3 | Koblenz |
|
| 1953 | 150 | ||
| 1957 | |||
| 1961 | |||
| 1965 | |||
| 1969 | |||
| 1972 |
| ||
| 1976 | |||
| 1980 | 148 | ||
| 1983 | |||
| 1987 | |||
| 1990 | |||
| 1994 | |||
| 1998 | |||
| 2002 | 202 |
| |
| 2005 | 201 | ||
| 2009 | 200 | ||
| 2013 | |||
| 2017 | 199 | ||
| 2021 |
Members
The constituency has been held continuously by the Christian Democratic Union (CDU) since its creation. It was first represented by Karl Weber from 1949 to 1965. Egon Klepsch then served from 1965 to 1980. He was succeeded by Roswitha Verhülsdonk, who was representative until 1994. Karl-Heinz Scherhag served from 1994 to 2002. Michael Fuchs was representative from 2002 to 2017. Josef Oster was elected in the 2017 election.
| Election | Member | Party | % | |
|---|---|---|---|---|
| 1949 | Karl Weber | CDU | 57.5 | |
| 1953 | 62.1 | |||
| 1957 | 61.7 | |||
| 1961 | 56.8 | |||
| 1965 | Egon Klepsch | CDU | 56.8 | |
| 1969 | 52.1 | |||
| 1972 | 49.4 | |||
| 1976 | 52.3 | |||
| 1980 | Roswitha Verhülsdonk | CDU | 48.4 | |
| 1983 | 54.8 | |||
| 1987 | 50.2 | |||
| 1990 | 48.8 | |||
| 1994 | Karl-Heinz Scherhag | CDU | 50.1 | |
| 1998 | 46.2 | |||
| 2002 | Michael Fuchs | CDU | 44.1 | |
| 2005 | 45.4 | |||
| 2009 | 44.1 | |||
| 2013 | 48.0 | |||
| 2017 | Josef Oster | CDU | 41.3 | |
Election results
2017 election
| Federal election (2017): Koblenz[3] | |||||||||
|---|---|---|---|---|---|---|---|---|---|
| Notes: |
Blue background denotes the winner of the electorate vote.
| ||||||||
| Party | Candidate | Votes | % | ±% | Party votes | % | ±% | ||
| CDU | Josef Oster | 61,594 | 41.3 | 56,616 | 37.8 | ||||
| SPD | Detlev Pilger | 42,777 | 28.7 | 35,679 | 23.8 | ||||
| AfD | Thomas Damson | 12,153 | 8.2 | 13,701 | 9.2 | ||||
| FDP | Florian Glock | 9,732 | 6.5 | 16,152 | 10.8 | ||||
| Green | Patrick Zwiernik | 9,273 | 6.2 | 11,862 | 7.9 | ||||
| Left | Ulrich Lenz | 7,693 | 5.2 | 10,332 | 6.9 | ||||
| FW | Stefan Scheer | 2,623 | 1.8 | 1,627 | 1.1 | ||||
| PARTEI | Andreas Werner Müller | 1,723 | 1.2 | 1,715 | 1.1 | ||||
| Pirates | Marieluise Charlotte Salm | 1,058 | 0.7 | 741 | 0.5 | ||||
| Independent | Jan-Peter Babnik | 383 | 0.3 | ||||||
| V-Partei³ | 370 | 0.2 | |||||||
| ÖDP | 302 | 0.2 | |||||||
| NPD | 252 | 0.2 | |||||||
| BGE | 242 | 0.2 | |||||||
| MLPD | 38 | 0.0 | |||||||
| Informal votes | 2,144 | 1,524 | |||||||
| Total Valid votes | 149,009 | 149,629 | |||||||
| Turnout | 151,153 | 76.7 | |||||||
| CDU hold | Majority | 18,817 | 12.6 | ||||||
2013 election
| Federal election (2013): Koblenz[4] | |||||||||
|---|---|---|---|---|---|---|---|---|---|
| Notes: |
Blue background denotes the winner of the electorate vote.
| ||||||||
| Party | Candidate | Votes | % | ±% | Party votes | % | ±% | ||
| CDU | 67,046 | 48.0 | 63,427 | 45.0 | |||||
| SPD | Detlev Pilger | 43,094 | 30.8 | 38,221 | 27.1 | ||||
| Green | Josef Winkler | 11,184 | 8.0 | 10,853 | 7.7 | ||||
| Left | Bettina Lau | 6,901 | 4.9 | 7,358 | 5.2 | ||||
| AfD | 6,625 | 4.7 | |||||||
| Pirates | Heiko Müller | 3,953 | 2.8 | 3,073 | 2.2 | ||||
| FDP | Martin Kaschny | 3,772 | 2.7 | 7,595 | 5.4 | ||||
| FW | Stephan Wefelscheid | 3,745 | 2.7 | 1,714 | 1.2 | ||||
| NPD | 938 | 0.7 | |||||||
| ÖDP | 324 | 0.2 | |||||||
| PRO | 282 | 0.2 | |||||||
| Party of Reason | 248 | 0.2 | |||||||
| REP | 176 | 0.1 | |||||||
| MLPD | 29 | 0.0 | |||||||
| Informal votes | 3,193 | 2,025 | |||||||
| Total Valid votes | 139,695 | 140,863 | |||||||
| Turnout | 142,888 | 72.1 | |||||||
| CDU hold | Majority | 23,952 | 17.2 | ||||||
2009 election
| Federal election (2009): Koblenz[5] | |||||||||
|---|---|---|---|---|---|---|---|---|---|
| Notes: |
Blue background denotes the winner of the electorate vote.
| ||||||||
| Party | Candidate | Votes | % | ±% | Party votes | % | ±% | ||
| CDU | 59,853 | 44.1 | 49,065 | 36.0 | |||||
| SPD | Ursula Mogg | 38,080 | 28.1 | 32,414 | 23.8 | ||||
| Green | Josef Winkler | 13,222 | 9.7 | 13,732 | 10.1 | ||||
| FDP | Markus Falk | 13,084 | 9.6 | 23,679 | 17.4 | ||||
| Left | Wolfgang Ferner | 9,935 | 7.3 | 11,239 | 8.2 | ||||
| Pirates | 2,690 | 2.0 | |||||||
| NPD | Sven Lobeck | 1,483 | 1.1 | 1,188 | 0.9 | ||||
| FAMILIE | 1,118 | 0.8 | |||||||
| REP | 432 | 0.3 | |||||||
| ÖDP | 324 | 0.2 | |||||||
| PBC | 227 | 0.2 | |||||||
| DVU | 98 | 0.1 | |||||||
| MLPD | 31 | 0.0 | |||||||
| Informal votes | 3,133 | 2,553 | |||||||
| Total Valid votes | 135,657 | 136,237 | |||||||
| Turnout | 138,790 | 70.6 | |||||||
| CDU hold | Majority | 21,773 | 16.0 | ||||||
References
- "Constituency Koblenz". Federal Returning Officer.
- "Results for Koblenz". Federal Returning Officer.
- Results for Koblenz
- Results for Koblenz
- Results for Koblenz
| Current | |
|---|---|
| Other states |
|
| See also | |