Neuwied (electoral district)
Neuwied is an electoral constituency (German: Wahlkreis) represented in the Bundestag. It elects one member via first-past-the-post voting. Under the current constituency numbering system, it is designated as constituency 197. It is located in northern Rhineland-Palatinate, comprising the districts of Neuwied and Altenkirchen.[1]
| 197 Neuwied | |
|---|---|
| electoral district for the Bundestag | |
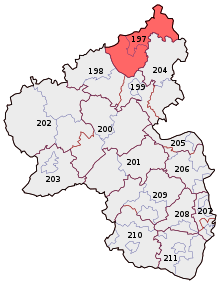 Neuwied in 2017 | |
| State | Rhineland-Palatinate |
| Population | 309,800 (2015) |
| Electorate | 239,284 (2017) |
| Major settlements | Neuwied Betzdorf |
| Area | 1,268.9 km2 |
| Current electoral district | |
| Created | 1949 |
| Party | CDU |
| Member | Erwin Rüddel |
| Elected | 2009, 2013, 2017 |
Neuwied was created for the inaugural 1949 federal election. Since 2009, it has been represented by Erwin Rüddel of the Christian Democratic Union (CDU).[2]
Geography
Neuwied is located in northern Rhineland-Palatinate. As of the 2021 federal election, it comprises the districts of Neuwied and Altenkirchen.[1]
History
Neuwied was created in 1949, then known as Altenkirchen (Westerwald). It acquired its current name in the 1965 election. In the 1949 election, it was Rhineland-Palatinate constituency 1 in the numbering system. In the 1953 through 1976 elections, it was number 148. In the 1980 through 1998 elections, it was number 146. In the 2002 election, it was number 200. In the 2005 election, it was number 199. In the 2009 and 2013 elections, it was number 198. Since the 2017 election, it has been number 197. Its borders have not changed since its creation.
| Election | No. | Name | Borders |
|---|---|---|---|
| 1949 | 1 | Altenkirchen (Westerwald) |
|
| 1953 | 148 | ||
| 1957 | |||
| 1961 | |||
| 1965 | Neuwied | ||
| 1969 | |||
| 1972 | |||
| 1976 | |||
| 1980 | 146 | ||
| 1983 | |||
| 1987 | |||
| 1990 | |||
| 1994 | |||
| 1998 | |||
| 2002 | 200 | ||
| 2005 | 199 | ||
| 2009 | 198 | ||
| 2013 | |||
| 2017 | 197 | ||
| 2021 |
Members
The constituency was first represented by Franz-Josef Wuermeling of the Christian Democratic Union (CDU) frmo 1949 to 1969. He was succeeded by fellow CDU member Walter Hallstein for a single term before the constituency was won by Klaus Immer of the Social Democratic Party (SPD). Heinz Schwarz regained it for the CDU after one term in 1976, and was representative until 1990. Ulrich Schmalz of the CDU served from 1990 to 1998. Ludwig Eich of the SPD was elected in 1998 and served a single term before being succeeded by fellow SPD member Sabine Bätzing until 2005. Erwin Rüddel of the CDU was elected in 2009, and re-elected in 2013 and 2017.
| Election | Member | Party | % | |
|---|---|---|---|---|
| 1949 | Franz-Josef Wuermeling | CDU | 53.6 | |
| 1953 | 56.2 | |||
| 1957 | 57.6 | |||
| 1961 | 53.1 | |||
| 1965 | 54.3 | |||
| 1969 | Walter Hallstein | CDU | 51.2 | |
| 1972 | Klaus Immer | SPD | 46.9 | |
| 1976 | Heinz Schwarz | CDU | 50.4 | |
| 1980 | 46.7 | |||
| 1983 | 53.7 | |||
| 1987 | 49.0 | |||
| 1990 | Ulrich Schmalz | CDU | 47.8 | |
| 1994 | 46.9 | |||
| 1998 | Ludwig Eich | SPD | 45.5 | |
| 2002 | Sabine Bätzing | SPD | 44.9 | |
| 2005 | 44.3 | |||
| 2009 | Erwin Rüddel | CDU | 39.2 | |
| 2013 | 46.9 | |||
| 2017 | 43.2 | |||
Election results
2017 election
| Federal election (2017): Neuwied[3] | |||||||||
|---|---|---|---|---|---|---|---|---|---|
| Notes: |
Blue background denotes the winner of the electorate vote.
| ||||||||
| Party | Candidate | Votes | % | ±% | Party votes | % | ±% | ||
| CDU | 76,933 | 43.2 | 68,357 | 38.2 | |||||
| SPD | Martin Diedenhofen | 50,996 | 28.6 | 45,447 | 25.4 | ||||
| AfD | Andreas Bleck | 16,954 | 9.5 | 19,273 | 10.8 | ||||
| FDP | Sandra Weeser | 10,898 | 6.1 | 18,071 | 10.1 | ||||
| Left | Jochen Bülow | 9,521 | 5.3 | 11,338 | 6.3 | ||||
| Green | Anna Neuhof | 9,449 | 5.3 | 10,738 | 6.0 | ||||
| FW | Sascha Müller | 3,285 | 1.8 | 1,982 | 1.1 | ||||
| PARTEI | 1,495 | 0.8 | |||||||
| Pirates | 726 | 0.4 | |||||||
| NPD | 480 | 0.3 | |||||||
| V-Partei³ | 396 | 0.2 | |||||||
| ÖDP | 374 | 0.2 | |||||||
| BGE | 297 | 0.2 | |||||||
| MLPD | Johann-Albrecht Rommel | 169 | 0.1 | 86 | 0.0 | ||||
| Informal votes | 3,402 | 2,547 | |||||||
| Total Valid votes | 178,205 | 179,060 | |||||||
| Turnout | 181,607 | 75.9 | |||||||
| CDU hold | Majority | 25,937 | 14.6 | ||||||
2013 election
| Federal election (2013): Neuwied[4] | |||||||||
|---|---|---|---|---|---|---|---|---|---|
| Notes: |
Blue background denotes the winner of the electorate vote.
| ||||||||
| Party | Candidate | Votes | % | ±% | Party votes | % | ±% | ||
| CDU | 79,785 | 46.9 | 78,005 | 45.6 | |||||
| SPD | Sabine Bätzing-Lichtenthäler | 63,453 | 37.3 | 48,866 | 28.6 | ||||
| Left | Jochen Bülow | 7,655 | 4.5 | 8,965 | 5.2 | ||||
| Green | Elisabeth Bröskamp | 6,779 | 4.0 | 10,661 | 6.2 | ||||
| AfD | 8,759 | 5.1 | |||||||
| FDP | Sandra Weeser | 3,906 | 2.3 | 8,023 | 4.7 | ||||
| Pirates | Peter König | 3,418 | 2.0 | 3,249 | 1.9 | ||||
| FW | Oliver Weihrauch | 3,114 | 1.8 | 1,657 | 1.0 | ||||
| NPD | Uwe Weber | 2,179 | 1.3 | 1,610 | 0.9 | ||||
| PRO | 355 | 0.2 | |||||||
| Party of Reason | 354 | 0.2 | |||||||
| ÖDP | 322 | 0.2 | |||||||
| REP | 262 | 0.2 | |||||||
| MLPD | 68 | 0.0 | |||||||
| Informal votes | 3,247 | 2,380 | |||||||
| Total Valid votes | 170,289 | 171,156 | |||||||
| Turnout | 173,536 | 72.2 | |||||||
| CDU hold | Majority | 16,332 | 9.6 | ||||||
2009 election
| Federal election (2009): Neuwied[5] | |||||||||
|---|---|---|---|---|---|---|---|---|---|
| Notes: |
Blue background denotes the winner of the electorate vote.
| ||||||||
| Party | Candidate | Votes | % | ±% | Party votes | % | ±% | ||
| CDU | Erwin Rüddel | 66,214 | 39.2 | 61,307 | 36.0 | ||||
| SPD | 61,544 | 36.4 | 42,279 | 24.9 | |||||
| FDP | Elke Hoff | 17,881 | 10.6 | 28,754 | 16.9 | ||||
| Left | Olcay Kanmaz | 11,331 | 6.7 | 15,360 | 9.0 | ||||
| Green | Hildegard Lingnau | 9,518 | 5.6 | 14,005 | 8.2 | ||||
| Pirates | 2,758 | 1.6 | |||||||
| NPD | Christian Bieler | 2,438 | 1.4 | 1,820 | 1.1 | ||||
| FAMILIE | 1,548 | 0.9 | |||||||
| PBC | 1,022 | 0.6 | |||||||
| REP | 689 | 0.4 | |||||||
| ÖDP | 327 | 0.2 | |||||||
| DVU | 123 | 0.1 | |||||||
| MLPD | 72 | 0.0 | |||||||
| Informal votes | 3,873 | 2,735 | |||||||
| Total Valid votes | 168,926 | 170,064 | |||||||
| Turnout | 172,799 | 71.2 | |||||||
| CDU gain from SPD | Majority | 4,670 | 2.8 | ||||||
References
- "Constituency Neuwied". Federal Returning Officer.
- "Results for Neuwied". Federal Returning Officer.
- Results for Neuwied
- Results for Neuwied
- Results for Neuwied
| Current | |
|---|---|
| Other states |
|
| See also | |
