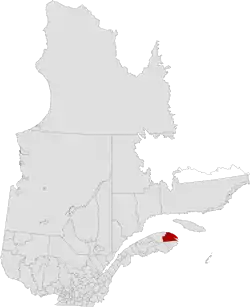
La Côte-de-Gaspé Regional County Municipality
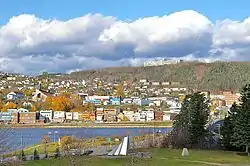
La Côte-de-Gaspé is a regional county municipality on the Gaspé peninsula in eastern Quebec, Canada, part of the Gaspésie–Îles-de-la-Madeleine region. The seat is Gaspé.
La Côte-de-Gaspé | |
|---|---|
 | |
| Coordinates: 49°10′N 64°55′W[1] | |
| Country | |
| Province | |
| Region | Gaspésie–Îles-de-la-Madeleine |
| Effective | January 1, 1982 |
| County seat | Gaspé |
| Government | |
| • Type | Prefecture |
| • Prefect | François Roussy |
| Area | |
| • Total | 4,306.50 km2 (1,662.75 sq mi) |
| • Land | 4,098.80 km2 (1,582.56 sq mi) |
| Population (2016)[3] | |
| • Total | 17,117 |
| • Density | 4.2/km2 (11/sq mi) |
| • Change 2011-2016 | |
| Time zone | UTC−5 (EST) |
| • Summer (DST) | UTC−4 (EDT) |
| Area code(s) | 418 and 581 |
| Website | www |
The regional county has a land area of 4,098.80 square kilometres (1,582.56 sq mi) and its population was 17,117 inhabitants as of the 2016 Census.[3] Its largest community is the city of Gaspé.
Subdivisions
There are 7 subdivisions within the RCM:[2]
|
|
|
|
Demographics
Population
| Canada census – La Côte-de-Gaspé Regional County Municipality, Quebec community profile | |||
|---|---|---|---|
| 2016 | 2011 | 2006 | |
| Population: | 17,117 (-4.8% from 2011) | 17,985 (+0.5% from 2006) | 17,888 (-3.5% from 2001) |
| Land area: | 4,098.80 km2 (1,582.56 sq mi) | 4,097.66 km2 (1,582.12 sq mi) | 4,097.13 km2 (1,581.91 sq mi) |
| Population density: | 4.2/km2 (11/sq mi) | 4.4/km2 (11/sq mi) | 4.4/km2 (11/sq mi) |
| Median age: | 51.1 (M: 50.5, F: 51.6) | 48.4 (M: 47.9, F: 48.9) | 45.7 (M: 45.3, F: 46.1) |
| Total private dwellings: | 8,648 | 8,486 | 8,026 |
| Median household income: | $57,676 | $50,936 | $43,255 |
| References: 2016[4] 2011[5] 2006[6] earlier[7] | |||
|
| ||||||||||||||||||||||||
| [8][9][3] | |||||||||||||||||||||||||
Language
| Canada Census Mother Tongue - La Côte-de-Gaspé Regional County Municipality, Quebec[8][9][3] | ||||||||||||||||||
|---|---|---|---|---|---|---|---|---|---|---|---|---|---|---|---|---|---|---|
| Census | Total | French |
English |
French & English |
Other | |||||||||||||
| Year | Responses | Count | Trend | Pop % | Count | Trend | Pop % | Count | Trend | Pop % | Count | Trend | Pop % | |||||
2016 |
16,855 |
14,965 | 88.8% | 1,600 | 9.5% | 185 | 1.1% | 105 | 0.6% | |||||||||
2011 |
17,830 |
15,860 | 88.95% | 1,735 | 9.73% | 175 | 0.98% | 60 | 0.34% | |||||||||
2006 |
17,635 |
15,395 | 87.30% | 1,920 | 10.89% | 110 | 0.62% | 210 | 1.19% | |||||||||
2001 |
18,275 |
16,240 | 88.86% | 1,845 | 10.10% | 135 | 0.74% | 55 | 0.30% | |||||||||
1996 |
20,585 |
17,955 | n/a | 87.22% | 2,365 | n/a | 11.49% | 215 | n/a | 1.04% | 50 | n/a | 0.24% | |||||
Transportation
Access Routes

Highways and numbered routes that run through the municipality, including external routes that start or finish at the county border:[10]
References
- Reference number 141099 of the Commission de toponymie du Québec (in French)
- Geographic code 030 in the official Répertoire des municipalités (in French)
- "Census Profile, 2016 Census: La Côte-de-Gaspé, Municipalité régionale de comté [Census division], Quebec". Statistics Canada. Retrieved November 29, 2019.
- "2016 Community Profiles". 2016 Canadian Census. Statistics Canada. February 21, 2017. Retrieved 2019-11-29.
- "2011 Community Profiles". 2011 Canadian Census. Statistics Canada. July 5, 2013. Retrieved 2014-04-18.
- "2006 Community Profiles". 2006 Canadian Census. Statistics Canada. March 30, 2011. Retrieved 2014-04-18.
- "2001 Community Profiles". 2001 Canadian Census. Statistics Canada. February 17, 2012.
- Statistics Canada: 1996, 2001, 2006, 2011 census
- "(Code 2403) Census Profile". 2011 census. Statistics Canada. 2012.
- Official Transport Quebec Road Map
Adjacent Counties & Equivalent Territories | |
|---|---|
| Regional county municipalities and equivalent territories | |
|---|---|
| Municipalities | |
This article is issued from Wikipedia. The text is licensed under Creative Commons - Attribution - Sharealike. Additional terms may apply for the media files.