Leicester East (UK Parliament constituency)
Leicester East is a constituency[n 1] represented in the House of Commons of the UK Parliament since December 2019 by Claudia Webbe, who was elected as a Labour MP, but currently sits as an Independent due to her suspension from the party in September 2020 after she was charged with harassment.[2]
| Leicester East | |
|---|---|
| Borough constituency for the House of Commons | |
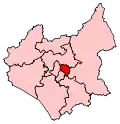 Boundary of Leicester East in Leicestershire | |
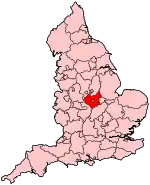 Location of Leicestershire within England | |
| County | Leicestershire |
| Electorate | 74,377 (December 2010)[1] |
| Current constituency | |
| Created | 1974 |
| Member of Parliament | Claudia Webbe (Independent) |
| Number of members | One |
| Created from | Leicester South East Leicester North East |
| 1918–1950 | |
| Number of members | One |
| Replaced by | Leicester South East Leicester North East |
| Created from | Leicester |
Boundaries
1918–1950: The County Borough of Leicester wards of Belgrave, Latimer, Spinney Hill, and West Humberstone.
1974–1983: The County Borough of Leicester wards of Belgrave, Charnwood, Evington, Humberstone, and Latimer.
1983–2010: The City of Leicester wards of Belgrave, Charnwood, Coleman, Evington, Humberstone, Latimer, Rushey Mead, Thurncourt, and West Humberstone.
2010–present: The City of Leicester wards of Belgrave, Charnwood, Coleman, Evington, Humberstone & Hamilton, Latimer, Rushey Mead, and Thurncourt.
2015–present: The City of Leicester wards of Belgrave, Rushey Mead, Troon, North Evington, Evington, Humberstone & Hamilton and Thurncourt.
The newly-created Troon Ward replaced the old Charnwood Ward covering the Northfields Estate and the adjacent Industrial Estate Area to the north, of which it takes its name.
Constituency profile
This is an urban seat in the commercial and engineering centre of Leicester. The seat excludes the heart of the city centre, skirting its tightly planned ring road. A golf course is situated in the south-east and a large municipal garden in the north-west of the boundaries.
Leicester East has a relatively high Asian population. In the 2011 census, two-thirds of the population were non-white and 48.5% of people described themselves as Asian. Almost a third of the population are Hindu and the majority of others of Asian ethnicity are of Muslim or Sikh faiths. Those of mixed ethnicities are gradually increasing — to 3.1% of the population in 2011.
The bulk of the eastern outskirts are relatively compact and much of the remainder of the county by the 21st century has become transformed economically into a retirement and commuter belt for the city and its railway links. The division's south-west quarter is within normal walking distance of all parts of Leicester City Centre and the seat is served by buses and cycle routes into the city centre.
History
First creation
The seat was created in 1918 and for the next four years was served by Sir Gordon Hewart KC, resigning to become Lord Chief Justice of England and Wales. In 1950 the area was divided between Leicester North East and Leicester South East, which also covered part of the present Charnwood seat and Rutland and Melton.
Second creation, current creation
In 1974 the seat was recreated.
- Summary of results
Leicester East has been won by the Labour Party's candidate in 10 of 11 elections since its recreation. Its MP, Keith Vaz, had won an absolute majority (plurality) of votes since the 1992 general election. The 2015 result made the seat the 37-safest of Labour's 232 seats by percentage of majority.[3] Leicester East was narrowly won by Conservative candidate Bruinvels at the height of the Tory party's popularity in 1983;[n 2] the following election saw Labour's Keith Vaz regain the seat; he has held it at every election thereafter, and since 1992 has always won by margins of over 20% and 11,000 votes. Vaz won his highest majority ever, 22,428 votes (42.8%), in 2017. In 2019 Labour held the seat with a substantially reduced majority of 6,019, down from 22,428 - a swing of 15%.
- Opposition parties
The candidate fielded by the Conservative Party has been runner-up in every election save for Bruinvels' win in 1983. The candidate of UKIP for the first time took third place in 2015, her 2010 counterpart having won 1.5% of the vote and the party not having stood before. The pro-UKIP swing between 2010 and 2015 elections, of 7.4%, was less than the national average of 9.5%. Cooper fell 1.8% short of second place in 2005, giving the best result of a Liberal Democrat to date, attracting just under one fifth of the vote.
- Turnout
Turnout in the recreated seat has ranged between 78.7% in 1992 to 62.1% in 2001.
Members of Parliament
MPs 1918–1950
MPs since 1974
| Year | Member[4] | Party | |
|---|---|---|---|
| Feb 1974 | Tom Bradley | Labour | |
| 1981 | Social Democrat | ||
| 1983 | Peter Bruinvels | Conservative | |
| 1987 | Keith Vaz | Labour | |
| 2019 | Claudia Webbe | ||
| Sep 2020 | Independent | ||
Elections
Elections in the 2010s
| Party | Candidate | Votes | % | ±% | |
|---|---|---|---|---|---|
| Labour | Claudia Webbe | 25,090 | 50.8 | -16.2 | |
| Conservative | Bhupendra Dave | 19,071 | 38.6 | +14.4 | |
| Liberal Democrats | Nitesh Dave | 2,800 | 5.7 | +3.1 | |
| Brexit Party | Tara Baldwin | 1,243 | 2.5 | New | |
| Green | Melanie Wakley | 888 | 1.8 | -0.2 | |
| Independent | Sanjay Gogia | 329 | 0.7 | New | |
| Majority | 6,019 | 12.2 | -30.6 | ||
| Turnout | 49,421 | 63.0 | -4.4 | ||
| Labour hold | Swing | -15.3 | |||
| Party | Candidate | Votes | % | ±% | |
|---|---|---|---|---|---|
| Labour | Keith Vaz | 35,116 | 67.0 | +5.9 | |
| Conservative | Edward Yi He | 12,688 | 24.2 | +1.2 | |
| Independent | Sujata Barot | 1,753 | 3.3 | New | |
| Liberal Democrats | Nitesh Dave | 1,343 | 2.6 | 0.0 | |
| Green | Melanie Wakley | 1,070 | 2.0 | -1.1 | |
| Independent | Ian Fox | 454 | 0.9 | New | |
| Majority | 22,428 | 42.8 | +4.6 | ||
| Turnout | 52,424 | 67.4 | +3.7 | ||
| Labour hold | Swing | +2.3 | |||
| Party | Candidate | Votes | % | ±% | |
|---|---|---|---|---|---|
| Labour | Keith Vaz | 29,386 | 61.1 | +7.4 | |
| Conservative | Kishan Devani | 11,034 | 23.0 | -1.5 | |
| UKIP | Susanna Steptoe | 4,290 | 8.9 | +7.4 | |
| Green | Nimit Jethwa | 1,468 | 3.1 | +1.5 | |
| Liberal Democrats | Dave Raval | 1,233 | 2.6 | -11.6 | |
| TUSC | Michael Barker | 540 | 1.1 | New | |
| Independent | Tom Darwood | 117 | 0.2 | New | |
| Majority | 18,352 | 38.2 | +8.9 | ||
| Turnout | 48,599 | 63.7 | -2.1 | ||
| Labour hold | Swing | +4.5 | |||
| Party | Candidate | Votes | % | ±% | |
|---|---|---|---|---|---|
| Labour | Keith Vaz | 25,804 | 53.8 | −5.0 | |
| Conservative | Jane Hunt | 11,722 | 24.4 | +4.6 | |
| Liberal Democrats | Ali Asghar | 6,817 | 14.2 | −2.3 | |
| BNP | Colin Gilmore[8] | 1,700 | 3.5 | New | |
| Green | Mo Taylor[9] | 733 | 1.5 | New | |
| UKIP | Felicity Ransome | 725 | 1.5 | New | |
| Unity for Peace and Socialism | Avtar Sadiq | 494 | 1.0 | New | |
| Majority | 14,082 | 29.3 | -9.6 | ||
| Turnout | 47,995 | 65.8 | +3.9 | ||
| Labour hold | Swing | −4.8 | |||
Elections in the 2000s
| Party | Candidate | Votes | % | ±% | |
|---|---|---|---|---|---|
| Labour | Keith Vaz | 24,015 | 58.1 | +0.5 | |
| Conservative | Suella Fernandes | 8,139 | 19.7 | −4.8 | |
| Liberal Democrats | Susan Cooper | 7,052 | 17.1 | +4.8 | |
| Veritas | Colin Brown | 1,666 | 4.0 | New | |
| Socialist Labour | Valerie Smalley | 434 | 1.1 | −1.0 | |
| Majority | 15,876 | 38.4 | +5.3 | ||
| Turnout | 41,306 | 62.2 | +0.1 | ||
| Labour hold | Swing | +2.6 | |||
In 2005 this seat bucked the national trend as there was a swing to Labour whereas the national swing was 2.5% to the Conservatives.
| Party | Candidate | Votes | % | ±% | |
|---|---|---|---|---|---|
| Labour | Keith Vaz | 23,402 | 57.6 | −7.9 | |
| Conservative | John Mugglestone | 9,960 | 24.5 | +0.5 | |
| Liberal Democrats | Harpinder Athwal | 4,989 | 12.3 | +5.3 | |
| Socialist Labour | David Roberts | 837 | 2.1 | +1.1 | |
| BNP | Clive Potter | 772 | 1.9 | New | |
| Independent | Shirley Bennett | 701 | 1.7 | +1.5 | |
| Majority | 13,442 | 33.1 | -8.4 | ||
| Turnout | 40,661 | 62.1 | −7.0 | ||
| Labour hold | Swing | -4.2 | |||
Elections in the 1990s
| Party | Candidate | Votes | % | ±% | |
|---|---|---|---|---|---|
| Labour | Keith Vaz | 29,083 | 65.50 | +9.2 | |
| Conservative | Simon Milton | 10,661 | 24.01 | -9.7 | |
| Liberal Democrats | Jay Matabudul | 3,105 | 6.99 | -1.1 | |
| Referendum | Philip Iwaniw | 1,015 | 2.29 | New | |
| Socialist Labour | Sohan Singh Sidhu | 436 | 0.98 | New | |
| Independent | Neil Slack | 102 | 0.23 | New | |
| Majority | 18,422 | 41.49 | +18.8 | ||
| Turnout | 44,402 | 69.11 | |||
| Labour hold | Swing | +9.4 | |||
| Party | Candidate | Votes | % | ±% | |
|---|---|---|---|---|---|
| Labour | Keith Vaz | 28,123 | 56.3 | +10.1 | |
| Conservative | Jeffery C. Stevens | 16,807 | 33.7 | −8.8 | |
| Liberal Democrats | Sheila A. Mitchell | 4,043 | 8.1 | −3.3 | |
| Green | Murray R. Frankland | 453 | 0.9 | New | |
| Independent | Dennis J. Taylor | 308 | 0.6 | New | |
| Natural Law | ASK Mahaldar | 186 | 0.4 | New | |
| Majority | 11,316 | 22.6 | +18.9 | ||
| Turnout | 49,920 | 78.7 | +0.1 | ||
| Labour hold | Swing | +9.5 | |||
Elections in the 1980s
| Party | Candidate | Votes | % | ±% | |
|---|---|---|---|---|---|
| Labour | Keith Vaz | 24,074 | 46.2 | +9.2 | |
| Conservative | Peter Bruinvels | 22,150 | 42.47 | +3.6 | |
| SDP | Aileen Ayres | 5,935 | 11.38 | -9.7 | |
| Majority | 1,924 | 3.69 | N/A | ||
| Turnout | 52,159 | 78.59 | |||
| Labour gain from Conservative | Swing | ||||
| Party | Candidate | Votes | % | ±% | |
|---|---|---|---|---|---|
| Conservative | Peter Bruinvels | 19,117 | 38.94 | -2.34 | |
| Labour | Patricia Hewitt | 18,184 | 37.04 | -9.86 | |
| SDP | Tom Bradley | 10,362 | 21.11 | +21.11 | |
| Independent | RV Ganatra | 970 | 1.98 | New | |
| BNP | RL Sutton | 459 | 0.93 | New | |
| Majority | 933 | 1.90 | N/A | ||
| Turnout | 49,092 | 73.19 | |||
| Conservative gain from Labour | Swing | ||||
Elections in the 1970s
| Party | Candidate | Votes | % | ±% | |
|---|---|---|---|---|---|
| Labour | Tom Bradley | 23,844 | 46.90 | +2.12 | |
| Conservative | M Waterhouse | 20,988 | 41.28 | +4.75 | |
| Liberal | B Andrews | 4,623 | 9.09 | -3.18 | |
| National Front | BJ Calver | 1,385 | 2.72 | -3.70 | |
| Majority | 2,856 | 5.62 | -2.63 | ||
| Turnout | 50,840 | 75.58 | |||
| Labour hold | Swing | ||||
| Party | Candidate | Votes | % | ±% | |
|---|---|---|---|---|---|
| Labour | Tom Bradley | 20,688 | 44.78 | +0.1 | |
| Conservative | KG Reeves | 16,877 | 36.53 | -8.3 | |
| Liberal | W Capstick | 5,668 | 12.27 | New | |
| National Front | A Reed-Herbert | 2,967 | 6.42 | -1.1 | |
| Majority | 3,811 | 8.25 | +6.35 | ||
| Turnout | 46,200 | 72.30 | |||
| Labour hold | Swing | ||||
| Party | Candidate | Votes | % | ±% | |
|---|---|---|---|---|---|
| Labour | Tom Bradley | 23,474 | 47.7 | N/A | |
| Conservative | K.G. Reeves | 22,061 | 44.8 | N/A | |
| National Front | K. Sanders | 3,662 | 7.5 | N/A | |
| Majority | 1,413 | 2.9 | N/A | ||
| Turnout | 49,199 | 77.8 | N/A | ||
| Labour win (new seat) | |||||
Elections in the 1940s
| Party | Candidate | Votes | % | ±% | |
|---|---|---|---|---|---|
| Labour | Terence Donovan | 28,414 | 56.94 | ||
| Conservative | Abraham Lyons | 15,182 | 30.42 | ||
| Liberal | David Goodwillie Galloway | 6,306 | 12.64 | ||
| Majority | 13,232 | 26.52 | N/A | ||
| Turnout | 49,902 | 76.05 | |||
| Labour gain from Conservative | Swing | ||||
Elections in the 1930s
| Party | Candidate | Votes | % | ±% | |
|---|---|---|---|---|---|
| Conservative | Abraham Lyons | 20,442 | 49.28 | ||
| Labour | Frederick Gould | 17,532 | 42.62 | ||
| Liberal | Frederick Lawson | 3,509 | 8.46 | New | |
| Majority | 2,910 | 6.66 | |||
| Turnout | 41,483 | 70.18 | |||
| Conservative hold | Swing | ||||
| Party | Candidate | Votes | % | ±% | |
|---|---|---|---|---|---|
| Conservative | Abraham Lyons | 30,265 | 68.67 | ||
| Labour | Frank Wise | 13,811 | 31.33 | ||
| Majority | 16,454 | 37.34 | N/A | ||
| Turnout | 44,076 | 79.10 | |||
| Conservative gain from Labour | Swing | ||||
Elections in the 1920s
| Party | Candidate | Votes | % | ±% | |
|---|---|---|---|---|---|
| Labour | Frank Wise | 22,533 | 50.8 | +1.5 | |
| Unionist | John Loder | 13,801 | 31.1 | −19.6 | |
| Liberal | Frederick Lawson | 8,054 | 18.1 | New | |
| Majority | 8,732 | 19.7 | N/A | ||
| Turnout | 44,388 | 81.6 | +2.0 | ||
| Registered electors | 54,364 | ||||
| Labour gain from Unionist | Swing | +1.6 | |||
| Party | Candidate | Votes | % | ±% | |
|---|---|---|---|---|---|
| Unionist | John Loder | 16,090 | 50.7 | +22.7 | |
| Labour | George Banton | 15,669 | 49.3 | +4.5 | |
| Majority | 421 | 1.4 | N/A | ||
| Turnout | 31,759 | 79.6 | +3.5 | ||
| Registered electors | 39,906 | ||||
| Unionist gain from Labour | Swing | +9.1 | |||
| Party | Candidate | Votes | % | ±% | |
|---|---|---|---|---|---|
| Labour | George Banton | 13,162 | 44.8 | −2.9 | |
| Unionist | Arthur Evans | 8,247 | 28.0 | New | |
| Liberal | James Henderson-Stewart | 7,998 | 27.2 | −25.1 | |
| Majority | 4,915 | 16.8 | N/A | ||
| Turnout | 29,407 | 76.1 | −0.8 | ||
| Registered electors | 38,658 | ||||
| Labour gain from National Liberal | Swing | +11.1 | |||
| Party | Candidate | Votes | % | ±% | |
|---|---|---|---|---|---|
| National Liberal | Arthur Evans | 15,164 | 52.3 | N/A | |
| Labour | George Banton | 13,850 | 47.7 | +20.6 | |
| Majority | 1,314 | 4.6 | N/A | ||
| Turnout | 29,014 | 76.9 | +11.3 | ||
| Registered electors | 37,749 | ||||
| National Liberal gain from Liberal | Swing | N/A | |||
| Party | Candidate | Votes | % | ±% | |
|---|---|---|---|---|---|
| Labour | George Banton | 14,062 | 52.9 | +25.8 | |
| Coalition Liberal | Albert E. Marlow | 8,710 | 32.7 | −40.2 | |
| Liberal | Ronald Wilberforce Allen | 3,825 | 14.4 | N/A | |
| Majority | 5,352 | 20.1 | N/A | ||
| Turnout | 26,597 | 71.3 | +5.7 | ||
| Registered electors | 37,319 | ||||
| Labour gain from Coalition Liberal | Swing | +33.0 | |||
Election in the 1910s
| Party | Candidate | Votes | % | ±% | |
|---|---|---|---|---|---|
| C | Liberal | Gordon Hewart | 18,024 | 72.9 | |
| Labour | George Banton | 6,697 | 27.1 | ||
| Majority | 11,327 | 45.8 | |||
| Turnout | 24,721 | 65.6 | |||
| Registered electors | 37,687 | ||||
| Liberal win (new seat) | |||||
| C indicates candidate endorsed by the coalition government. | |||||
Notes
- A borough constituency (for the purposes of election expenses and type of returning officer).
- Soon thereafter, a lay canon, Peter Bruinvels served the seat 1983-1987.
References
- "2011 Electorate Figures". Boundary Commission for England. 4 March 2011. Archived from the original on 6 November 2010. Retrieved 13 March 2011.
- Walker, Peter; Syal, Rajeev (28 September 2020). "Labour suspends MP Claudia Webbe over harassment charge". The Guardian. Retrieved 28 September 2020.
- List of Labour MPs elected in 2015 by % majority UK Political.info. Retrieved 2017-01-29
- Leigh Rayment's Historical List of MPs – Constituencies beginning with "L" (part 2)
- "Leicester East Parliamentary constituency". BBC News. BBC. Retrieved 22 November 2019.
- "Election Data 2015". Electoral Calculus. Archived from the original on 17 October 2015. Retrieved 17 October 2015.
- "Election Data 2010". Electoral Calculus. Archived from the original on 26 July 2013. Retrieved 17 October 2015.
- "Full slate in Leicestershire as BNP candidate nominated in Leicester East". BNP. March 2010. Archived from the original on 30 March 2010.
- "Green Candidate Mo Taylor for Leicester East". Green Party. Archived from the original on 6 March 2012. Retrieved 24 June 2016.
- "Election Data 2005". Electoral Calculus. Archived from the original on 15 October 2011. Retrieved 18 October 2015.
- "Election Data 2001". Electoral Calculus. Archived from the original on 15 October 2011. Retrieved 18 October 2015.
- "Election Data 1997". Electoral Calculus. Archived from the original on 15 October 2011. Retrieved 18 October 2015.
- "Election Data 1992". Electoral Calculus. Archived from the original on 15 October 2011. Retrieved 18 October 2015.
- "General Election 1992". Politics Resources. 9 April 1992. Archived from the original on 24 July 2011. Retrieved 6 December 2010.
- "Election Data 1987". Electoral Calculus. Archived from the original on 15 October 2011. Retrieved 18 October 2015.
- "Election Data 1983". Electoral Calculus. Archived from the original on 15 October 2011. Retrieved 18 October 2015.
- "UK General Election results: February 1974 [Archive]". Politics Resources. Retrieved 24 June 2016.
- Craig, F. W. S. (1969). British Parliamentary Election Results 1918-1949. Glasgow: Political Reference Publications.