Lesser Slave Lake (electoral district)
Lesser Slave Lake is a provincial electoral district for the Legislative Assembly of Alberta, Canada. It has existed since 1971 and is mandated to return a single member using the first past the post method of voting.
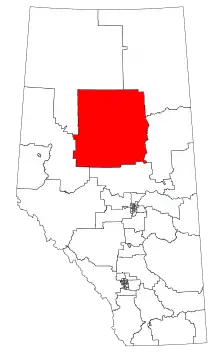 Lesser Slave Lake within Alberta, 2017 boundaries | |||
| Provincial electoral district | |||
| Legislature | Legislative Assembly of Alberta | ||
| MLA |
Independent | ||
| District created | 1971 | ||
| First contested | 1971 | ||
| Last contested | 2015 | ||
The riding is named after the lake of the same name, which is located entirely within its borders.
Geography
Lesser Slave Lake is a predominantly rural riding located in Northern Alberta.
There are no cities in the riding. It includes only two incorporated urban municipalities: the towns of High Prairie and Slave Lake. The riding also includes the entirety of one rural municipality (the Municipal District of Opportunity No. 17) and parts of three others (Big Lakes County, the Municipal District of Lesser Slave River No. 124, and Northern Sunrise County).
Eleven First Nation bands are based in Lesser Slave Lake: Bigstone Cree Nation, Driftpile First Nation, Kapawe'no First Nation, Loon River Cree Nation, Lubicon Lake Indian Nation, Peerless Trout First Nation, Sawridge First Nation, Sucker Creek Cree First Nation, Swan River First Nation, Whitefish Lake First Nation, and Woodland Cree First Nation. Most of the region's Indigenous population is of Cree origin.
The riding borders five other electoral districts: Peace River to the northwest, Fort McMurray-Wood Buffalo to the northeast, Fort McMurray-Lac La Biche to the east, Athabasca-Barrhead-Westlock to the south, and Central Peace-Notley to the west.
History
The electoral district was created in the 1971 boundary re-distribution from the electoral districts of Grouard and Peace River. The district remained largely unchanged until the 1993 boundary re-distribution when the electoral district was extended north to the Northwest Territories, Alberta border.
The 2003 boundary re-distribution saw the district revert to similar boundaries that existed prior to 1993.[1] The 2010 boundary re-distribution saw the district re-aligned with current municipal boundaries with a portion of land on the south end moved into Barrhead-Morinville-Westlock.[2]
In the 2017 electoral boundary re-distribution only minor changes were made to the districts boundaries, which were enlarged to include the Calling Lake Reserve.[3]
Lesser Slave Lake is one of two electoral districts in the province that are afforded the exemption provided in the Electoral Boundaries Commission Act whereby only four electoral districts in Alberta may have a population which is as much as 50% below the average population of all the proposed electoral districts.[4] The rationale for this exemption is the relatively low population in the region and large distances between population centers. The total population of the district in the 2017 re-distribution was 27,818 which is 41% below the provincial average for electoral districts.[3]
Boundary history
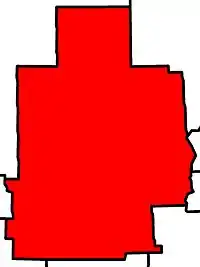
| 63 Lesser Slave Lake 2003 Boundaries[5] | |||
|---|---|---|---|
| Bordering Districts | |||
| North | East | West | South |
| Peace River | Athabasca-Redwater, Fort McMurray-Wood Buffalo, Lac La Biche-St. Paul | Dunvegan-Central Peace, Peace River | Barrhead-Morinville-Westlock, Grande Prairie-Smoky |
| riding map goes here | 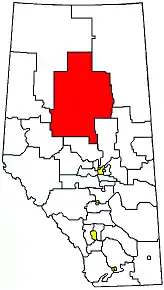 | ||
| Legal description from Electoral Divisions Act, S.A. 2003, c. E-4.1 | |||
| Starting at the east boundary of Rge. 12 W5 and the north boundary of Twp. 105; then 1. east along the north boundary of Twp. 105 to the 5th meridian; 2. south along the 5th meridian to the north boundary of Twp. 96; 3. east along the north boundary to the east boundary of Rge. 20 W4; 4. south along the east boundary to the north boundary of Twp. 95; 5. east along the north boundary to the east boundary of Rge. 18 W4; 6. south along the east boundary to the intersection with the right bank of the Athabasca River; 7. upstream along the right bank of the Athabasca River to the north boundary of Twp. 75, Rge. 18 W4; 8. west along the north boundary of Twp. 75 to the east boundary of Rge. 26 W4; 9. south along the east boundary of Rge. 26 W4 to the north boundary of Twp. 68; 10. east along the north boundary of Twp. 68 to the east boundary of Rge. 25 W4; 11. south along the east boundary to the north boundary of Twp. 66; 12. west along the north boundary of Twp. 66 to the east boundary of Sec. 34 in Twp. 66, Rge. 25 W4; 13. south along Secs. 34, 27, 22, 15, 10 and 3 in Twps. 66 and 65 to the north boundary of Twp. 64; 14. west along the north boundary of Twp. 64 to the right bank of the Athabasca River; 15. downstream along the right bank of the Athabasca River to the north boundary of Twp. 67 in Rge. 2 W5; 16. west along the north boundary to the east boundary of Rge. 19 W5; 17. north along the east boundary to the north boundary of Twp. 70; 18. west along the north boundary to the east boundary of Rge. 20 W5; 19. north along the east boundary to the north boundary of Twp. 73; 20. east along the north boundary to the east boundary of Rge. 19 W5; 21. north along the east boundary of Rge. 19 W5 to the north boundary of Twp. 77; 22. west along the north boundary of Twp. 77 to the east boundary of Sec. 3 in Twp. 78, Rge. 19 W5; 23. north along the east boundary of Sec. 3 to the north boundary of Sec. 3 in the Twp.; 24. west along the north boundary of Secs. 3, 4 and 5 to the east boundary of Sec. 7; 25. north along the east boundary of Secs. 7, 18, 19, 30 and 31 in Twp. 78 to the north boundary of Twp. 78; 26. west along the north boundary to the east boundary of Rge. 20 W5; 27. north along the east boundary of Rge. 20 W5 to the north boundary of Twp. 79; 28. east along the north boundary of Twp. 79 to the east boundary of Rge. 18 W5; 29. north along the east boundary of Rge. 18 W5 to the north boundary of Twp. 96; 30. east along the north boundary of Twp. 96 to the east boundary of Rge. 12 W5; 31. north along the east boundary of Rge. 12 W5 to the starting point. | |||
| Note: | |||
| 02 Lesser Slave Lake 2010 Boundaries[6] | |||
|---|---|---|---|
| Bordering Districts | |||
| North | East | West | South |
| Peace River | Fort McMurray-Conklin, Fort McMurray-Wood Buffalo and Lac La Biche-St. Paul-Two Hills | Dunvegan-Central Peace-Notley, Grande Prairie-Smoky and Peace River | Athabasca-Sturgeon-Redwater and Barrhead-Morinville-Westlock |
 |
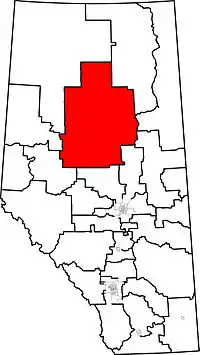 | ||
| Note: Boundary descriptions were not used in the 2010 redistribution | |||
Representation history
| Members of the Legislative Assembly for Lesser Slave Lake | ||||
|---|---|---|---|---|
| Assembly | Years | Member | Party | |
| See Grouard 1913-1971 and Peace River 1905-1971 | ||||
| 17th | 1971-1975 | Dennis Barton | Social Credit | |
| 18th | 1975-1979 | Larry Shaben | Progressive Conservative | |
| 19th | 1979-1982 | |||
| 20th | 1982-1986 | |||
| 21st | 1986-1989 | |||
| 22nd | 1989-1993 | Pearl Calahasen | ||
| 23rd | 1993-1997 | |||
| 24th | 1997-2001 | |||
| 25th | 2001-2004 | |||
| 26th | 2004-2008 | |||
| 27th | 2008–2012 | |||
| 28th | 2012–2015 | |||
| 29th | 2015–2019 | Danielle Larivee | New Democrat | |
| 30th | 2019–2021 | Pat Rehn | United Conservative | |
| 2021–present | Independent | |||
The electoral district was created in 1971. Prior to the districts creation the area had elected Social Credit MLA's. The first election saw a tight race between Social Credit candidate Dennis Barton and Progressive Conservative candidate Garth Roberts. Barton eked out a win with just 41% of the popular vote.
Barton would be defeated in the 1975 election by Progressive Conservative candidate Larry Shaben who rolled up a landslide majority. Shaben would serve four terms in office and hold three different cabinet portfolios under the governments of Peter Lougheed and Don Getty before retiring from office in 1989.
The third representative of the riding was Progressive Conservative candidate Pearl Calahasen who was elected to her first term in 1989 in a tight three-way race winning less than half the popular vote. She would also serve some ministerial portfolios from 1996 to 2006 in the government of Ralph Klein. She represented the district for seven terms, becoming the longest-serving female MLA in Alberta history,[7] as well as the longest-serving Indigenous MLA.
In the 2015 election, Calahasen placed third of three candidates and was defeated by the NDP's Danielle Larivee, who served in several ministerial portfolios during the 29th Assembly.
Legislature results
Elections in the 1970s
| 1971 Alberta general election | ||||||||
|---|---|---|---|---|---|---|---|---|
| Party | Candidate | Votes | % | |||||
| Social Credit | Dennis Barton | 1,830 | 41.49% | |||||
| Progressive Conservative | Garth Roberts | 1,434 | 32.51% | |||||
| New Democratic | Marie Carlson | 670 | 15.19% | |||||
| Liberal | Stan Daniels | 246 | 5.58% | |||||
| Independent | Allan Crawford | 231 | 5.23% | |||||
| Total | 4,411 | 100.00% | ||||||
| Rejected, spoiled and declined | 55 | |||||||
| Eligible electors / Turnout | 7,174 | 62.25% | ||||||
| Social Credit pickup new district. | ||||||||
Source(s)
"Lesser Slave Lake Official Results 1971 Alberta general election". Alberta Heritage Community Foundation. Retrieved March 1, 2010. | ||||||||
| 1975 Alberta general election | ||||||||
|---|---|---|---|---|---|---|---|---|
| Party | Candidate | Votes | % | ±% | ||||
| Progressive Conservative | Larry Shaben | 2,387 | 58.23% | +25.72% | ||||
| Social Credit | Dennis Barton | 921 | 22.47% | -19.02% | ||||
| New Democratic | John Tomkins | 791 | 19.30% | +4.11% | ||||
| Total | 4,099 | 100.00% | ||||||
| Rejected, spoiled and declined | 23 | |||||||
| Eligible electors / Turnout | 7,904 | 52.15% | -10.10% | |||||
| Progressive Conservative gain from Social Credit | Swing | +22.37% | ||||||
Source(s)
"Lesser Slave Lake Official Results 1975 Alberta general election". Alberta Heritage Community Foundation. Retrieved March 1, 2010. | ||||||||
| 1979 Alberta general election | ||||||||
|---|---|---|---|---|---|---|---|---|
| Party | Candidate | Votes | % | ±% | ||||
| Progressive Conservative | Larry Shaben | 2,313 | 46.02% | -12.21% | ||||
| Social Credit | Peter Moore | 1,743 | 34.68% | +12.21% | ||||
| New Democratic | Mike Poulter | 799 | 15.90% | -3.40% | ||||
| Liberal | Dan Backs | 171 | 3.40% | |||||
| Total | 5,026 | 100.00% | ||||||
| Rejected, spoiled and declined | 22 | |||||||
| Eligible electors / Turnout | 8,252 | 61.17% | +9.02% | |||||
| Progressive Conservative hold | Swing | -12.21% | ||||||
Source(s)
"Lesser Slave Lake Official Results 1979 Alberta general election". Alberta Heritage Community Foundation. Retrieved March 1, 2010. | ||||||||
Elections in the 1980s
| 1982 Alberta general election | ||||||||
|---|---|---|---|---|---|---|---|---|
| Party | Candidate | Votes | % | ±% | ||||
| Progressive Conservative | Larry Shaben | 3,150 | 57.77% | +11.75% | ||||
| New Democratic | Gary Kennedy | 914 | 16.76% | +0.86% | ||||
| Western Canada Concept | Garth Lodge | 607 | 11.13% | |||||
| Liberal | Joseph Blyan | 466 | 8.55% | +5.15% | ||||
| Independent | George Keay | 316 | 5.79% | |||||
| Total | 5,453 | 100.00% | ||||||
| Rejected, spoiled and declined | 27 | |||||||
| Eligible electors / Turnout | 9,667 | 56.69% | -4.48% | |||||
| Progressive Conservative hold | Swing | +6.31% | ||||||
Source(s)
"Lesser Slave Lake Official Results 1982 Alberta general election". Alberta Heritage Community Foundation. Retrieved March 1, 2010. | ||||||||
| 1986 Alberta general election | ||||||||
|---|---|---|---|---|---|---|---|---|
| Party | Candidate | Votes | % | ±% | ||||
| Progressive Conservative | Larry Shaben | 2,529 | 57.20% | -0.57% | ||||
| New Democratic | Bert Dube | 1,892 | 42.80% | +26.04% | ||||
| Total | 4,421 | 100.00% | ||||||
| Rejected, spoiled and declined | 24 | |||||||
| Eligible electors / Turnout | 11,326 | 39.25% | -17.44% | |||||
| Progressive Conservative hold | Swing | -13.59% | ||||||
Source(s)
"Lesser Slave Lake Official Results 1986 Alberta general election". Alberta Heritage Community Foundation. Retrieved March 1, 2010. | ||||||||
| 1989 Alberta general election | ||||||||
|---|---|---|---|---|---|---|---|---|
| Party | Candidate | Votes | % | ±% | ||||
| Progressive Conservative | Pearl Calahasen | 3,249 | 47.58% | -9.62% | ||||
| Liberal | Denise Wahlstrom | 2,286 | 33.47% | |||||
| New Democratic | Philip Lukken | 1,294 | 18.95% | -23.85% | ||||
| Total | 6,829 | 100.00% | ||||||
| Rejected, spoiled and declined | 9 | |||||||
| Eligible electors / Turnout | 12,074 | 56.63% | +17.38% | |||||
| Progressive Conservative hold | Swing | -16.74% | ||||||
Source(s)
"Lesser Slave Lake Official Results 1989 Alberta general election". Alberta Heritage Community Foundation. Retrieved March 1, 2010. | ||||||||
Elections in the 1990s
| 1993 Alberta general election | ||||||||
|---|---|---|---|---|---|---|---|---|
| Party | Candidate | Votes | % | ±% | ||||
| Progressive Conservative | Pearl Calahasen | 4,260 | 55.48% | +7.90% | ||||
| Liberal | Denise Wahlstrom | 3,093 | 40.28% | +6.81% | ||||
| New Democratic | Larry Sakaluk | 326 | 4.24% | -14.71% | ||||
| Total | 7,679 | 100.00% | ||||||
| Rejected, spoiled and declined | 24 | |||||||
| Eligible electors / Turnout | 12,743 | 60.48% | +3.85% | |||||
| Progressive Conservative hold | Swing | +7.36% | ||||||
Source(s)
"Lesser Slave Lake Official Results 1993 Alberta general election". Alberta Heritage Community Foundation. Retrieved March 1, 2010. | ||||||||
| 1997 Alberta general election | ||||||||
|---|---|---|---|---|---|---|---|---|
| Party | Candidate | Votes | % | ±% | ||||
| Progressive Conservative | Pearl Calahasen | 3,389 | 60.58% | +5.10% | ||||
| Liberal | Ralph Chalifoux | 1,139 | 20.36% | -19.92% | ||||
| Social Credit | Robert Alford | 624 | 11.16% | |||||
| New Democratic | Glenn Laboucan | 442 | 7.90% | +3.66% | ||||
| Total | 5,594 | 100.00% | ||||||
| Rejected, spoiled and declined | 23 | |||||||
| Eligible electors / Turnout | 13,368 | 42.09% | -18.39% | |||||
| Progressive Conservative hold | Swing | +12.51% | ||||||
Source(s)
"1997 general election". Elections Alberta. Archived from the original on February 14, 2012. Retrieved January 15, 2012. | ||||||||
Elections in the 2000s
| 2001 Alberta general election | ||||||||
|---|---|---|---|---|---|---|---|---|
| Party | Candidate | Votes | % | ±% | ||||
| Progressive Conservative | Pearl Calahasen | 4,766 | 74.16% | +13.58% | ||||
| Liberal | Rick Noel | 1,429 | 22.23% | +1.87% | ||||
| New Democratic | Doris Bannister | 232 | 3.61% | -4.29% | ||||
| Total | 6,427 | 100.00% | ||||||
| Rejected, spoiled and declined | 47 | |||||||
| Eligible electors / Turnout | 14,185 | 45.64% | +3.55% | |||||
| Progressive Conservative hold | Swing | +7.73% | ||||||
Source(s)
"Lesser Slave Lake Official Results 2001 Alberta general election" (PDF). Elections Alberta. Retrieved March 27, 2010. | ||||||||
| 2004 Alberta general election | ||||||||
|---|---|---|---|---|---|---|---|---|
| Party | Candidate | Votes | % | ±% | ||||
| Progressive Conservative | Pearl Calahasen | 3,903 | 64.94% | -9.22% | ||||
| Alberta Alliance | Valerie Rahn | 969 | 16.12% | |||||
| Liberal | Jonathan Plackaitis | 530 | 8.82% | -13.41% | ||||
| New Democratic | Doris Bannister | 354 | 5.89% | 2.28% | ||||
| Greens | Ian Hopfe | 254 | 4.23% | |||||
| Total | 6,010 | 100.00% | ||||||
| Rejected, spoiled and declined | 57 | |||||||
| Eligible electors / Turnout | 19,259 | 31.50% | -14.14% | |||||
| Progressive Conservative hold | Swing | -12.67% | ||||||
Source(s)
"Lesser Slave Lake Statement of Official Results 2004 Alberta general election" (PDF). Elections Alberta. Retrieved January 15, 2012. | ||||||||
| 2008 Alberta general election | ||||||||
|---|---|---|---|---|---|---|---|---|
| Party | Candidate | Votes | % | ±% | ||||
| Progressive Conservative | Pearl Calahasen | 3,384 | 65.18% | +0.24% | ||||
| Liberal | Steve Noskey | 1,109 | 21.36% | +12.54% | ||||
| New Democratic | Habby Sharkawi | 426 | 8.21% | +2.32% | ||||
| Greens | Bonnie Raho | 273 | 5.26% | +1.03% | ||||
| Total | 5,192 | 100.00% | ||||||
| Rejected, spoiled and declined | 43 | |||||||
| Eligible electors / Turnout | 20,310 | 25.78% | -5.72% | |||||
| Progressive Conservative hold | Swing | -6.39% | ||||||
Source(s)
The Report on the March 3, 2008 Provincial General Election of the Twenty-seventh Legislative Assembly. Elections Alberta. July 28, 2008. pp. 462–467. | ||||||||
Elections in the 2010s
| 2012 Alberta general election | ||||||||
|---|---|---|---|---|---|---|---|---|
| Party | Candidate | Votes | % | ±% | ||||
| Progressive Conservative | Pearl Calahasen | 3,518 | 48.71% | -16.47% | ||||
| Wildrose | Darryl Boisson | 2,847 | 39.42% | |||||
| New Democratic | Steve Kaz | 427 | 5.91% | -2.30% | ||||
| Liberal | Steven Townsend | 235 | 3.25% | -9.29% | ||||
| Independent | Donald G. Bissell | 195 | 2.70% | |||||
| Total | 7,222 | 100.00% | ||||||
| Rejected, spoiled and declined | 50 | |||||||
| Eligible electors / Turnout | 18,723 | 38.84% | +13.06% | |||||
| Progressive Conservative hold | Swing | -27.95% | ||||||

| 2015 Alberta general election | ||||||||
|---|---|---|---|---|---|---|---|---|
| Party | Candidate | Votes | % | ±% | ||||
| New Democratic | Danielle Larivee | 3,915 | 43.23% | +37.32% | ||||
| Wildrose | Darryl Boisson | 3,198 | 35.31% | -4.11% | ||||
| Progressive Conservative | Pearl Calahasen | 1,944 | 21.46% | -27.25% | ||||
| Total valid votes | 9,057 | 100.00% | ||||||
| Rejected, spoiled and declined | 50 | |||||||
| Eligible voters / Turnout | 20,277 | 44.91% | +6.07% | |||||
| New Democratic gain from Progressive Conservative | Swing | +32.29% | ||||||
Source(s)
"2015 Provincial General Election Results". Elections Alberta. Archived from the original on 2017-07-30. Retrieved 2017-07-30. | ||||||||
| 2019 Alberta general election | ||||||||
|---|---|---|---|---|---|---|---|---|
| Party | Candidate | Votes | % | ±% | ||||
| United Conservative | Pat Rehn | 5,873 | 57.7% | +0.93% | ||||
| New Democratic | Danielle Larivee | 3,676 | 36.1% | -7.13% | ||||
| Alberta Party | Vincent Rain | 381 | 3.7% | – | ||||
| Independent | Suzette Powder | 251 | 2.5% | – | ||||
| Total valid votes | 10,181 | – | – | |||||
| Rejected, spoiled, and declined | 58 | – | – | |||||
| Eligible electors / Turnout | 16,154 | 63.1% | – | |||||
| United Conservative notional hold | Swing | +4.06 | ||||||
Source(s)
Source: "70 - Lesser Slave Lake 2019 General Election Results". Elections Alberta. Retrieved June 3, 2020. | ||||||||
Senate nominee results
2004 Senate nominee election district results
| 2004 Senate nominee election results: Lesser Slave Lake[8] | Turnout 30.88% | |||||
| Affiliation | Candidate | Votes | % Votes | % Ballots | 'Rank | |
| Progressive Conservative | Betty Unger | 2,431 | 15.19% | 48.60% | 2 | |
| Progressive Conservative | Bert Brown | 2,324 | 14.52% | 46.46% | 1 | |
| Progressive Conservative | Cliff Breitkreuz | 1,850 | 11.56% | 36.99% | 3 | |
| Progressive Conservative | David Usherwood | 1,539 | 9.62% | 30.77% | 6 | |
| Progressive Conservative | Jim Silye | 1,513 | 9.46% | 30.25% | 5 | |
| Alberta Alliance | Michael Roth | 1,388 | 8.68% | 27.75% | 7 | |
| Alberta Alliance | Vance Gough | 1,364 | 8.52% | 27.27% | 8 | |
| Alberta Alliance | Gary Horan | 1,335 | 8.34% | 26.69% | 10 | |
| Independent | Link Byfield | 1,310 | 8.19% | 26.19% | 4 | |
| Independent | Tom Sindlinger | 947 | 5.92% | 18.93% | 9 | |
| Total Votes | 16,001 | 100% | ||||
| Total Ballots | 5,002 | 3.20 Votes Per Ballot | ||||
| Rejected, Spoiled and Declined | 945 | |||||
Voters had the option of selecting 4 Candidates on the Ballot
Student Vote results
2004 elections
| Participating Schools[9] |
|---|
| Gift Lake School |
| Kinuso School |
| Mistassiniy School |
| Pelican Mountain School |
| Roland Michener Secondary School |
| Smith School |
On November 19, 2004 a Student Vote was conducted at participating Alberta schools to parallel the 2004 Alberta general election results. The vote was designed to educate students and simulate the electoral process for persons who have not yet reached the legal majority. The vote was conducted in 80 of the 83 provincial electoral districts with students voting for actual election candidates. Schools with a large student body that reside in another electoral district had the option to vote for candidates outside of the electoral district then where they were physically located.
| 2004 Alberta Student Vote results[10] | ||||
| Affiliation | Candidate | Votes | % | |
| Progressive Conservative | Pearl Calahasen | 190 | 35.71% | |
| Liberal | Jonathan Plackaitis | 116 | 21.81% | |
| Green | Ian Hopfe | 98 | 18.42% | |
| NDP | Doris Bannister | 76 | 14.29% | |
| Alberta Alliance | Valerie Rahn | 52 | 9.77% | |
| Total | 532 | 100% | ||
| Rejected, Spoiled and Declined | 21 | |||
References
- Alberta Electoral Boundaries Commission (February 2003). "Proposed Electoral Division Areas, Boundaries, and Names for Alberta. Final Report to the Speaker of the Legislative Assembly of Alberta". Legislative Assembly of Alberta. Retrieved May 29, 2020.
- Alberta Electoral Boundaries Commission (June 2010). "Proposed Electoral Division Areas, Boundaries, and Names for Alberta. Final Report to the Speaker of the Legislative Assembly of Alberta" (PDF). Legislative Assembly of Alberta. ISBN 978-0-9865367-1-7. Retrieved May 29, 2020.
- Alberta Electoral Boundaries Commission (October 2017). "Proposed Electoral Division Areas, Boundaries, and Names for Alberta. Final Report to the Speaker of the Legislative Assembly of Alberta" (PDF). Legislative Assembly of Alberta. ISBN 978-1-988620-04-6. Retrieved May 29, 2020.
- Electoral Boundaries Commission Act, RSA 2000, c. E-3, s. 15
- Electoral Divisions Act, S.A. 2003, c. E-4.1
- "Bill 28 Electoral Divisions Act" (PDF). Legislative Assembly of Alberta. 2010.
- "Calahasen becomes longest serving woman MLA". Ammsa.com. Retrieved 2018-06-29.
- "Senate Nominee Election 2004 Tabulation of Official Results" (PDF). Elections Alberta. Archived from the original (PDF) on July 4, 2009. Retrieved February 28, 2010.
- "School by School results". Student Vote Canada. Archived from the original on October 5, 2007. Retrieved 2008-04-27.
- "Riding by Riding Results - the Candidates". Student Vote Canada. Archived from the original on October 6, 2007. Retrieved 2008-04-19.