1975 Alberta general election
The 1975 Alberta general election was the eighteenth general election for the Province of Alberta, Canada. It was held on March 26, 1975, to elect members of the Legislative Assembly of Alberta.
| |||||||||||||||||||||||||||||||||||||||||||||||||
75 seats in the Legislative Assembly of Alberta 38 seats were needed for a majority | |||||||||||||||||||||||||||||||||||||||||||||||||
|---|---|---|---|---|---|---|---|---|---|---|---|---|---|---|---|---|---|---|---|---|---|---|---|---|---|---|---|---|---|---|---|---|---|---|---|---|---|---|---|---|---|---|---|---|---|---|---|---|---|
| Turnout | 59.58% | ||||||||||||||||||||||||||||||||||||||||||||||||
| |||||||||||||||||||||||||||||||||||||||||||||||||
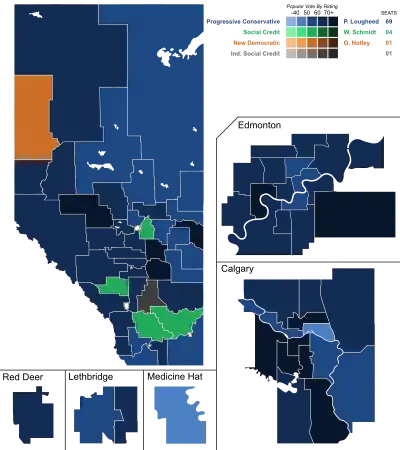
 Popular vote by riding. As this is a first-past-the-post election, seat totals are not determined by total popular vote, but instead by results in each riding. | |||||||||||||||||||||||||||||||||||||||||||||||||
| |||||||||||||||||||||||||||||||||||||||||||||||||
The Progressive Conservative Party of Peter Lougheed won its second term in government in a landslide, taking over 62% of the popular vote and winning 69 of the 75 seats in the legislature.
The Social Credit Party saw its vote collapse. After 36 years in government from 1935 to 1971—virtually its entire history—it was ill-prepared for a role in opposition. It lost over half of its popular vote from the previous election, and was cut down to only four MLAs—just barely holding onto official party status.
Results
Overall voter turnout was 59.58%.[1]
| Party | Party leader | # of candidates |
Seats | Popular vote | |||||
|---|---|---|---|---|---|---|---|---|---|
| 1971 | Elected | % Change | # | % | % Change | ||||
| Progressive Conservative | Peter Lougheed | 75 | 49 | 69 | +40.8% | 369,764 | 62.65% | +16.25% | |
| Social Credit | Werner Schmidt | 70 | 25 | 4 | -84.0% | 107,211 | 18.17% | -22.93% | |
| New Democrats | Grant Notley | 75 | 1 | 1 | 0% | 76,360 | 12.94% | +1.52% | |
| Independent Social Credit | 1 | * | 1 | 100% | 4,428 | 0.75% | * | ||
| Liberal | Nicholas Taylor | 46 | - | - | - | 29,424 | 4.98% | +3.97% | |
| Independent Progressive Conservative | 3 | * | - | * | 1,059 | 0.18% | * | ||
| Communist | 14 | * | - | * | 768 | 0.13% | * | ||
| Independent | 4 | - | - | 625 | 0.11% | +1.06% | |||
| Independent Liberal | 2 | * | - | * | 416 | 0.07% | * | ||
| Constitutional Socialist | Mike Uhryn | 3 | * | - | * | 115 | 0.02% | * | |
| Total | 293 | 75 | 75 | - | 590,200 | 100% | |||
| Source: Elections Alberta | |||||||||
Note:
* Party did not nominate candidates in the previous election.
Members elected
For complete electoral history, see individual districts.
See also
References
- Elections Alberta (November 25, 2007). "General Elections 1975-2004 (Overall Summary of Ballots Cast and % of Voter Turnout)". Archived from the original on August 15, 2011. Retrieved April 29, 2011.