Alberta provincial electoral districts

Alberta provincial electoral districts are currently single member ridings that each elect one member to the Legislative Assembly of Alberta. There are 87 districts fixed in law in Alberta.

History

The Calgary district in 1930.

The original twenty five districts were drawn up by Liberal Member of Parliament Frank Oliver prior to the first general election of 1905. The original boundaries were widely regarded as being gerrymandered to favor the Alberta Liberal Party, although the Liberal Party did receive the majority of votes in the 1905 election and thus rightly formed majority government. Every boundary redistribution since 1905 has been based on the original boundaries, with districts being split or merged.

From 1905 to 1926 with only a few exceptions each district elected a single member on the First Past the Post system. Calgary and Edmonton as well as Medicine Hat were elected on a plurality block vote, where each voter could cast as many votes as seats to be filled.

There have also been a couple of cases where members were elected outside of the geographical districts and did not represent any districts. Such was the case in the world wars when Albertans serving overseas voted for their own representatives.

From 1924 to 1956 Calgary and Edmonton MLAs were elected in multiple-member districts encompassing whole cities that used Single Transferable Vote to elect five to seven members. In 1926, Medicine Hat was a two-member district. Outside these cities single-member districts elected single MLAs using the Alternative Voting system, with vote transfers taking place only if no candidate had a majority of the vote. By-elections in the two big cities during this period were conducted using Alternative Voting. Under STV, some results were known as soon as the first vote count was done, but some seats took a couple days of vote transfers to fill. But the mixed representation elected in each city under STV, reflective of the mixed sentiment of the city's voters, was thought worth the wait.

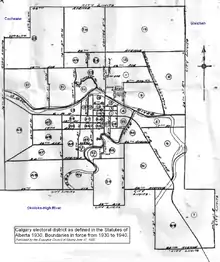
There were no district changes between 1926 and 1940.

With Alberta in a population boom in the fifties and Calgary and Edmonton growing, single transferable vote was seen as too complicated, with vote counting taking days before final results could be announced. The Social Credit government felt threatened by the growing number of opposition MLAs being elected, and in 1959 returned Alberta to First past the post elections in single-member districts. No government has since changed the electoral system.

In 1977 Elections Alberta was established as an independent, non-partisan office of the Legislative Assembly responsible for administering provincial elections, by-elections and referenda.

The early 1990s proved to be a contentious period for delineation of electoral districts in Alberta. The Supreme Court of British Columbia ruling in Dixon v. Attorney General of British Columbia in 1989 invalidated the provincial electoral district re-distribution due to wide variations between electoral district populations for British Columbia, finding these differences inconsistent with the Charter of Rights and Freedoms.[1] Cognizant of this the Alberta Legislature tasked a Special Committee chaired by Taber-Warner MLA Bob Bogle to evaluate the re-distribution of electoral districts in the province. The Report of the Select Special Committee on Electoral Boundaries was submitted to the Legislature in November 1990[2] and was referred to the Court of Appeal of Alberta. While the Court of Appeals reference found the boundaries consistent with the Charter,[3] the report was scrapped and amendments to the Electoral Divisions Act were introduced in early 1991 to effectively "Charter-proof" the new districts.[4]

The same Select Committee was tasked with creating the new report which was presented to the Legislature in November 1992,[5] and once again referred to the Court of Appeal of Alberta to rule on the constitutional validity of the boundaries. The four Progressive Conservative MLAs on the Select Committee (Bob Bogle, Stockwell Day, Pat Nelson, Mike Cardinal) participated fully in developing the report, while the Opposition refused to appoint any MLAs.[4] Subsequently, the boundaries were implemented and used for the June 1993 Alberta general election. The Court of Appeal of Alberta withheld Charter condemnation, but found numerous issues with the process and requirements put forward for the re-distribution. In particular the members of the Select Committee were unable to provide sufficient rationale to the court for a number of the boundaries and district sizes recommended in the report.[4] The court explicitly voiced the opinion that a proper electoral boundary review was necessary within the term of the present government (which would expire in 1997).[6]

Following the issues in the early-1990s, a semi-independent boundary commissions were set up to tweak the boundaries to population changes that occurred after every census. Committees are composed of a neutral Judge, two members appointed by the governing party, and two members appointed by the official opposition.

As is the case with nearly every other Canadian jurisdiction, the number of districts has not increased in proportion to the growth in the provincial population. In 1905, 25,000 votes were cast across the province to elect 25 MLAs. In 1982, 945,000 votes, almost 40 times the 1905 total, were cast across the province to choose 79 MLAs, less than four times the 1905 seat total. Prior to the 1986 election the number of districts was fixed by law at 83 thus any change to that number would have to be enacted by the legislature. Even though the population has increased by more than 40 percent since 1986, the number of districts did not change until 2010. The 2012 election saw the number increase to 87.

Naming conventions

Like the federal districts in Alberta, urban ridings traditionally begin with the city name. This has generally applied where an urban area is divided and joined with rural areas, such as Grande Prairie-Wapiti and Fort McMurray-Lac La Biche. Notable exceptions are Cypress-Medicine Hat and Brooks-Medicine Hat, which follow the convention in other rural areas of listing communities in alphabetical order (another exception being Vermilion-Lloydminster-Wainwright).

Unlike federal practice, Alberta uses hyphens to join all name elements. This is true for electoral districts named for multiple communities as well as urban districts (where the city name is followed by a direction, a neighbourhood, a landmark, or the name of a historical politician). For example, compare the provincial Fort McMurray-Conklin with the federal Fort McMurray—Cold Lake, where the em dash is used instead of the hyphen to join names of separate communities. Also compare the provincial Edmonton-Strathcona with the federal Edmonton Strathcona, where a space indicates that Strathcona is a neighbourhood of Edmonton.

Current districts named for individuals include several premiers:

Three are named for former party leaders:

In addition, Edmonton-McClung is named for suffragette and MLA Nellie McClung. The abolished riding of Edmonton-Roper was named for CCF leader Elmer Roper.

List of provincial electoral districts

Current districts

Name Created MLA Party Population (2016)
1Calgary-Acadia2012Tyler ShandroUnited Conservative48,966
2Calgary-Beddington2019Josephine PonUnited Conservative50,220
3Calgary-Bow1971Demetrios NicolaidesUnited Conservative51,358
4Calgary-Buffalo1971Joe CeciNew Democrat49,907
5Calgary-Cross1993Mickey AmeryUnited Conservative50,634
6Calgary-Currie1971Nicholas MillikenUnited Conservative48,403
7Calgary-East1963*Peter SinghUnited Conservative50,838
8Calgary-Edgemont2019Prasad PandaUnited Conservative50,803
9Calgary-Elbow1971Doug SchweitzerUnited Conservative48,618
10Calgary-Falconridge2019Devinder ToorUnited Conservative52,688
11Calgary-Fish Creek1979Richard GotfriedUnited Conservative47,691
12Calgary-Foothills1971Jason LuanUnited Conservative45,715
13Calgary-Glenmore1959Whitney IssikUnited Conservative49,543
14Calgary-Hays2004Ric McIverUnited Conservative50,782
15Calgary-Klein2012Jeremy NixonUnited Conservative50,338
16Calgary-Lougheed1993Jason KenneyUnited Conservative42,956
17Calgary-McCall1971Irfan SabirNew Democrat48,735
18Calgary-Mountain View1971Kathleen GanleyNew Democrat49,442
19Calgary-North1957*Muhammad YaseenUnited Conservative39,120
20Calgary-North East1959*Rajan SawhneyUnited Conservative40,366
21Calgary-North West1979Sonya SavageUnited Conservative48,766
22Calgary-Peigan2019Tanya FirUnited Conservative45,810
23Calgary-Shaw1986Rebecca SchulzUnited Conservative45,169
24Calgary-South East1959*Matt JonesUnited Conservative40,309
25Calgary-Varsity1993Jason CoppingUnited Conservative45,742
26Calgary-West1959Mike EllisUnited Conservative46,266
27Edmonton-Beverly-Clareview1997Deron BilousNew Democrat46,496
28Edmonton-Castle Downs1997Nicole GoehringNew Democrat46,112
29Edmonton-City Centre2019David ShepherdNew Democrat47,715
30Edmonton-Decore2004Chris NielsenNew Democrat48,927
31Edmonton-Ellerslie1993Rod LoyolaNew Democrat48,024
32Edmonton-Glenora1971Sarah HoffmanNew Democrat45,519
33Edmonton-Gold Bar1971Marlin SchmidtNew Democrat45,446
34Edmonton-Highlands-Norwood2004Janis IrwinNew Democrat43,550
35Edmonton-Manning1993Heather SweetNew Democrat48,376
36Edmonton-McClung1993Lorne DachNew Democrat44,625
37Edmonton-Meadows2019Jasvir DeolNew Democrat51,776
38Edmonton-Mill Woods1979Christina GrayNew Democrat50,265
39Edmonton-North West1959*David EggenNew Democrat45,523
40Edmonton-Riverview1997Lori SigurdsonNew Democrat45,214
41Edmonton-Rutherford1993Richard FeehanNew Democrat47,353
42Edmonton-South1917*Thomas DangNew Democrat45,801
43Edmonton-South West2012Kaycee MaduUnited Conservative45,901
44Edmonton-Strathcona1971Rachel NotleyNew Democrat46,578
45Edmonton-West Henday2019Jon CarsonNew Democrat43,046
46Edmonton-Whitemud1971Rakhi PancholiNew Democrat46,833
47Airdrie-Cochrane2019Peter GuthrieUnited Conservative51,170
48Airdrie-East2019Angela PittUnited Conservative49,978
49Athabasca-Barrhead-Westlock2019Glenn van DijkenUnited Conservative46,920
50Banff-Kananaskis2019Miranda RosinUnited Conservative46,824
51Bonnyville-Cold Lake-St. Paul2019Dave HansonUnited Conservative53,809
52Brooks-Medicine Hat2019Michaela GlasgoUnited Conservative51,070
53Camrose1921*Jackie LovelyUnited Conservative44,082
54Cardston-Siksika2019Joseph SchowUnited Conservative42,655
55Central Peace-Notley2019Todd LoewenUnited Conservative28,993
56Chestermere-Strathmore2019Leela AheerUnited Conservative48,203
57Cypress-Medicine Hat1993Drew BarnesUnited Conservative50,109
58Drayton Valley-Devon2012Mark SmithUnited Conservative46,637
59Drumheller-Stettler2004Nate HornerUnited Conservative41,535
60Fort McMurray-Lac La Biche2019Laila GoodridgeUnited Conservative44,166
61Fort McMurray-Wood Buffalo2004Tany YaoUnited Conservative41,420
62Fort Saskatchewan-Vegreville2004Jackie Armstrong-HomeniukUnited Conservative52,141
63Grande Prairie1930*Tracy AllardUnited Conservative46,343
64Grande Prairie-Wapiti1993Travis ToewsUnited Conservative48,481
65Highwood1971RJ SigurdsonUnited Conservative48,813
66Innisfail-Sylvan Lake1993Devin DreeshenUnited Conservative46,717
67Lac Ste. Anne-Parkland2019Shane GetsonUnited Conservative46,546
68Lacombe-Ponoka2004Ron OrrUnited Conservative44,898
69Leduc-Beaumont2012Brad RutherfordUnited Conservative48,337
70Lesser Slave Lake1971Pat RehnUnited Conservative27,818
71Lethbridge-East1971Nathan NeudorfUnited Conservative46,204
72Lethbridge-West1971Shannon PhillipsNew Democrat46,525
73Livingstone-Macleod1997Roger ReidUnited Conservative48,120
74Maskwacis-Wetaskiwin2019Rick WilsonUnited Conservative43,798
75Morinville-St. Albert2019Dale NallyUnited Conservative50,225
76Olds-Didsbury-Three Hills1997Nathan CooperUnited Conservative49,418
77Peace River1905Dan WilliamsUnited Conservative39,974
78Red Deer-North1986Adriana LaGrangeUnited Conservative47,672
79Red Deer-South1986Jason StephanUnited Conservative52,743
80Rimbey-Rocky Mountain House-Sundre2012Jason NixonUnited Conservative45,138
81Sherwood Park1986Jordan WalkerUnited Conservative45,992
82Spruce Grove-Stony Plain2019Searle TurtonUnited Conservative51,267
83St. Albert1905Marie RenaudNew Democrat47,745
84Strathcona-Sherwood Park2012Nate GlubishUnited Conservative47,853
85Taber-Warner1963*Grant HunterUnited Conservative42,625
86Vermilion-Lloydminster-Wainwright2019Garth RowswellUnited Conservative46,042
87West Yellowhead1986Martin LongUnited Conservative50,604

Districts prior to 2019 election

Name Created Last MLA   Party Population Median
Income, 2011[7]
2011[8] 2016[9]
Airdrie 2012 Angela Pitt United Conservative 45,955 57,930 $60,524
Athabasca-Sturgeon-Redwater 2012 Colin Piquette New Democratic 37,060 38,051 $56,741
Banff-Cochrane 1940* Cam Westhead New Democratic 46,075 63,990 $56,603
Barrhead-Morinville-Westlock 2004 Glenn Van Dijken   United Conservative 40,670 45,030 $48,588
Battle River-Wainwright 2004 Wes Taylor   United Conservative 37,675 36,905 $46,988
Bonnyville-Cold Lake 1997 Scott Cyr United Conservative 35,165 39,696 $59,996
Calgary-Acadia 2012 Brandy Payne New Democratic 37,890 43,000 $53,262
Calgary-Bow 1971 Deborah Drever New Democratic 39,520 45,049 $64,985
Calgary-Buffalo 1971 Kathleen Ganley New Democratic 39,415 52,963 $54,913
Calgary-Cross 1993 Ricardo Miranda New Democratic 46,195 59,406 $42,992
Calgary-Currie 1971 Brian Malkinson New Democratic 44,450 51,611 $53,241
Calgary-East 1963* Robyn Luff Independent 47,735 56,618 $43,880
Calgary-Elbow 1971 Greg Clark Alberta Party 45,760 48,363 $67,959
Calgary-Fish Creek 1979 Richard Gotfried United Conservative 38,455 40,566 $64,793
Calgary-Foothills 1971 Prasad Panda United Conservative 43,015 54,180 $65,262
Calgary-Fort 1997 Joe Ceci New Democratic 41,660 51,083 $46,862
Calgary-Glenmore 1959 Anam Kazim New Democratic 46,095 48,972 $58,712
Calgary-Greenway 2012 Prab Gill Independent 46,130 56,474 $41,333
Calgary-Hawkwood 2012 Michael Connolly New Democratic 47,520 52,223 $64,978
Calgary-Hays 2004 Ric McIver United Conservative 41,505 46,893 $66,327
Calgary-Klein 2012 Craig Coolahan New Democratic 42,800 49,130 $55,235
Calgary-Lougheed 1993 Jason Kenney United Conservative 47,285 54,734 $60,144
Calgary-Mackay-Nose Hill 2012 Karen McPherson Alberta Party 42,535 56,625 $54,491
Calgary-McCall 1971 Irfan Sabir New Democratic 45,245 68,523 $42,245
Calgary-Mountain View 1971 David Swann Liberal 40,850 47,808 $64,783
Calgary-North West 1979 Sandra Jansen New Democratic 46,460 51,011 $76,108
Calgary-Northern Hills 2012 Jamie Kleinsteuber New Democratic 51,610 61,377 $58,324
Calgary-Shaw 1986 Graham Sucha New Democratic 43,940 48,056 $63,218
Calgary-South East 1959* Rick Fraser Alberta Party 48,945 79,034 $64,020
Calgary-Varsity 1993 Stephanie McLean New Democratic 40,875 48,107 $60,908
Calgary-West 1959 Mike Ellis United Conservative 40,950 45,966 $85,624
Cardston-Taber-Warner 1997 Grant Hunter United Conservative 38,505 43,467 $44,658
Chestermere-Rocky View 2012 Leela Aheer United Conservative 45,925 46,966 $64,826
Cypress-Medicine Hat 1993 Drew Barnes United Conservative 40,345 41,148 $50,184
Drayton Valley-Devon 2012 Mark Smith United Conservative 40,215 47,883 $50,869
Drumheller-Stettler 2004 Rick Strankman United Conservative 36,840 37,852 $43,459
Dunvegan-Central Peace-Notley 2012 Marg McCuaig-Boyd New Democratic 23,050 25,192 $44,932
Edmonton-Beverly-Clareview 1997 Deron Bilous New Democratic 45,475 51,834 $49,755
Edmonton-Calder 1971* David Eggen New Democratic 44,655 53,918 $52,833
Edmonton-Castle Downs 1997 Nicole Goehring New Democratic 45,740 52,775 $54,878
Edmonton-Centre 1959 David Shepherd New Democratic 40,750 51,659 $48,993
Edmonton-Decore 2004 Chris Nielsen New Democratic 43,755 49,942 $48,398
Edmonton-Ellerslie 1993 Rod Loyola New Democratic 42,540 59,091 $54,820
Edmonton-Glenora 1971 Sarah Hoffman New Democratic 42,000 48,138 $50,122
Edmonton-Gold Bar 1971 Marlin Schmidt New Democratic 42,540 44,691 $58,042
Edmonton-Highlands-Norwood 2004 Brian Mason New Democratic 43,020 54,804 $46,860
Edmonton-Manning 1993 Heather Sweet New Democratic 44,860 51,953 $53,328
Edmonton-McClung 1993 Lorne Dach New Democratic 39,265 42,971 $55,752
Edmonton-Meadowlark 1971 Jon Carson New Democratic 41,925 52,039 $49,474
Edmonton-Mill Creek 1997 Denise Woollard New Democratic 41,495 56,995 $52,849
Edmonton-Mill Woods 1979 Christina Gray New Democratic 41,030 48,364 $49,154
Edmonton-Riverview 1997 Lori Sigurdson New Democratic 40,000 45,517 $57,990
Edmonton-Rutherford 1993 Richard Feehan New Democratic 40,185 45,255 $57,782
Edmonton-South West 2012 Thomas Dang New Democratic 43,780 66,489 $64,343
Edmonton-Strathcona 1971 Rachel Notley New Democratic 40,315 44,400 $51,350
Edmonton-Whitemud 1971 Bob Turner New Democratic 48,860 52,574 $72,504
Fort McMurray-Conklin 2012 Laila Goodridge United Conservative 26,075 29,533 $98,417
Fort McMurray-Wood Buffalo 2004 Tany Yao United Conservative 40,855 59,576 $106,908
Fort Saskatchewan-Vegreville 2004 Jessica Littlewood New Democratic 42,945 49,399 $57,137
Grande Prairie-Smoky 1993 Todd Loewen United Conservative 44,115 57,580 $57,038
Grande Prairie-Wapiti 1993 Wayne Drysdale United Conservative 48,800 56,975 $60,916
Highwood 1971 Wayne Anderson United Conservative 48,940 56,268 $60,078
Innisfail-Sylvan Lake 1993 Devin Dreeshen United Conservative 42,230 43,996 $51,930
Lac La Biche-St. Paul-Two Hills 2012 Dave Hanson United Conservative 30,790 38,260 $43,825
Lacombe-Ponoka 2004 Ron Orr United Conservative 39,760 44,389 $49,907
Leduc-Beaumont 2012 Shaye Anderson New Democratic 46,550 52,734 $58,093
Lesser Slave Lake 1971 Danielle Larivee New Democratic 27,700 30,094 $49,192
Lethbridge-East 1971 Maria Fitzpatrick New Democratic 43,175 44,927 $45,912
Lethbridge-West 1971 Shannon Phillips New Democratic 40,285 46,211 $49,241
Little Bow 1913 Dave Schneider United Conservative 37,755 39,627 $41,775
Livingstone-Macleod 1997 Pat Stier United Conservative 42,700 42,794 $46,943
Medicine Hat 1905* Bob Wanner New Democratic 38,350 44,469 $48,013
Olds-Didsbury-Three Hills 1997 Nathan Cooper United Conservative 43,010 47,038 $47,923
Peace River 1905 Debbie Jabbour New Democratic 35,680 41,492 $49,380
Red Deer-North 1986 Kim Schreiner New Democratic 43,765 58,914 $49,891
Red Deer-South 1986 Barb Miller New Democratic 46,800 51,627 $54,916
Rimbey-Rocky Mountain House-Sundre 2012 Jason Nixon United Conservative 40,205 41,942 $44,905
Sherwood Park 1986 Annie McKitrick New Democratic 41,475 45,474 $69,023
Spruce Grove-St. Albert 2012 Trevor Horne New Democratic 51,800 59,453 $63,117
St. Albert 1905 Marie Renaud New Democratic 44,420 48,430 $67,036
Stony Plain 1905 Erin Babcock New Democratic 42,430 47,018 $63,712
Strathcona-Sherwood Park 2012 Estefania Cortes-Vargas New Democratic 46,620 46,971 $71,299
Strathmore-Brooks 1997 Derek Fildebrandt Freedom Conservative 44,900 52,474 $50,121
Vermilion-Lloydminster 1993 Richard Starke Progressive Conservative 36,540 40,544 $52,877
West Yellowhead 1986 Eric Rosendahl New Democratic 30,995 36,901 $62,422
Wetaskiwin-Camrose 1993 Bruce Hinkley New Democratic 41,890 43,350 $47,164
Whitecourt-Ste. Anne 1993 Oneil Carlier New Democratic 37,190 39,128 $53,828

* District has been abolished and re-established.

Historical provincial electoral districts

See also

References

  1. Dixon v. Attorney General of British Columbia ,  [1989]  248 (BCSC)
  2. Select Special Committee on Electoral Boundaries; Bob Bogle (November 1990). Report of the Select Special Committee on Electoral Boundaries. Edmonton, AB: Legislative Assembly of Alberta. Retrieved 20 June 2020.
  3. Reference re: Order in Council O.C. 91/91 in Respect of the Electoral Boundaries Commission Act ,  [1991]  317 (ABCA)
  4. Stinson, Douglas (July 1, 1999). "Knowing Where to Draw the Line - Alberta Views - The Magazine for Engaged Citizens". albertaviews.ca. Retrieved 2018-05-31.
  5. Select Special Committee on Electoral Boundaries; Bob Bogle (November 1992). Report of the Select Special Committee on Electoral Boundaries: established by Motion 24, July 2, 1992. Edmonton, AB: Legislative Assembly of Alberta. Retrieved 20 June 2020.
  6. Reference re: Order in Council 215/93 Respecting the Electoral Divisions Statutes Amendment Act ,  [1994]  342 (ABCA)
  7. "Alberta Finance, 2011 Census" (PDF). Archived from the original (PDF) on 2016-03-04. Retrieved 2015-12-14.
  8. "Alberta Finance, 2011 Census" (PDF). Archived from the original (PDF) on 2016-03-04. Retrieved 2015-12-14.
  9. "Alberta Electoral Boundaries Commission: Stats". Archived from the original on 2017-01-08. Retrieved 2017-01-13.
This article is issued from Wikipedia. The text is licensed under Creative Commons - Attribution - Sharealike. Additional terms may apply for the media files.