List of natural gas power stations in the United States
This is a list of operational natural gas-fired power stations in the United States.

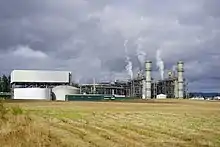
Chehalis Power Plant, a 698 MW natural gas power plant in Chehalis, Washington.
In 2015 there was around 1800 natural gas power stations in the United States.[1] In 2019, these natural gas plants produced 38% of the United States electricity production, the highest percentage of any source above coal, nuclear and renewables.[2] Natural gas power stations have been opening at a fast rate along with renewables since the early 2010's quickly replacing aging, dirty, and economically unviable coal-fired power stations.
Natural gas-fired power stations
See also
- List of Coal-fired power stations in the United States
- List of Power stations in the United States
- List of largest power stations in the United States
- Natural Gas power plant
- Natural Gas in the United States
- Natural gas
- Energy in the United States
- Electricity sector of the United States
- List of largest power stations
- List of countries by natural gas production
References
- "Mapping how the United States generates its electricity". Washington Post. Retrieved 2020-10-26.
- "Electricity in the U.S. - U.S. Energy Information Administration (EIA)". www.eia.gov. Retrieved 2020-10-26.
- "Electricity Data Browser". www.eia.gov. Retrieved 2020-11-11.
- Release, News; Club, Sierra (2020-08-14). "GenOn Files to Deactivate Chalk Point Coal Generating Station". The Southern Maryland Chronicle. Retrieved 2020-11-07.
- "Electricity Data Browser". www.eia.gov. Retrieved 2020-11-07.
- "Electricity Data Browser". www.eia.gov. Retrieved 2020-12-09.
- "Electricity Data Browser". www.eia.gov. Retrieved 2020-11-11.
- "Electricity Data Browser". www.eia.gov. Retrieved 2020-11-07.
- "Electricity Data Browser". www.eia.gov. Retrieved 2020-11-10.
- "Electricity Data Browser". www.eia.gov. Retrieved 2020-11-07.
- "Electricity Data Browser". www.eia.gov. Retrieved 2020-11-07.
- "Electricity Data Browser". www.eia.gov. Retrieved 2020-11-07.
- "Electricity Data Browser". www.eia.gov. Retrieved 2020-11-07.
- "Electricity Data Browser". www.eia.gov. Retrieved 2020-12-22.
- "Electricity Data Browser". www.eia.gov. Retrieved 2020-12-09.
- "Electricity Data Browser". www.eia.gov. Retrieved 2020-12-22.
- "Electricity Data Browser". www.eia.gov. Retrieved 2020-11-10.
- "Hines Energy Complex | Florida Department of Environmental Protection". floridadep.gov. Retrieved 2020-11-10.
- "Electricity Data Browser". www.eia.gov. Retrieved 2020-11-11.
- "Electricity Data Browser". www.eia.gov. Retrieved 2020-12-09.
- "Electricity Data Browser". www.eia.gov. Retrieved 2020-12-09.
- "United States - Maps - U.S. Energy Information Administration (EIA)". www.eia.gov. Retrieved 2020-12-09.
- "Electricity Data Browser". www.eia.gov. Retrieved 2020-12-22.
- "United States - Maps - U.S. Energy Information Administration (EIA)". www.eia.gov. Retrieved 2020-12-22.
- "Project Overview". Lackawanna Energy. Retrieved 2020-12-22.
- "Electricity Data Browser". www.eia.gov. Retrieved 2020-11-07.
- "Manatee Power Plant | Florida Department of Environmental Protection". floridadep.gov. Retrieved 2020-11-07.
- "Electricity Data Browser". www.eia.gov. Retrieved 2020-11-07.
- "Electricity Data Browser". www.eia.gov. Retrieved 2020-11-11.
- "Electricity Data Browser". www.eia.gov. Retrieved 2020-11-11.
- "Energy Justice Communities Map". www.energyjustice.net. Retrieved 2020-11-11.
- "Electricity Data Browser". www.eia.gov. Retrieved 2020-11-10.
- "Electricity Data Browser". www.eia.gov. Retrieved 2020-12-22.
- "Electricity Data Browser". www.eia.gov. Retrieved 2020-11-11.
- "Electricity Data Browser". www.eia.gov. Retrieved 2020-11-11.
- "Energy Justice Communities Map". www.energyjustice.net. Retrieved 2020-11-11.
- "Electricity Data Browser". www.eia.gov. Retrieved 2020-11-11.
- "Electricity Data Browser". www.eia.gov. Retrieved 2020-11-11.
- "Electricity Data Browser". www.eia.gov. Retrieved 2020-10-27.
- "Electricity Data Browser". www.eia.gov. Retrieved 2020-11-10.
- "Texas Power Plant Upgrades Restore Lost Megawatts to Meet Summer Demand". Power Engineering. 2002-03-01. Retrieved 2020-11-10.
- "Electricity Data Browser". www.eia.gov. Retrieved 2020-11-07.
- "Stanford Power Plant" (PDF). Florida Department of Environmental Protection. October 12, 2011.
- "Fpl Sanford Power Plant - DeBary, FL - Public Utility Company | Facebook". www.facebook.com. Retrieved 2020-11-07.
- "Electricity Data Browser". www.eia.gov. Retrieved 2020-12-22.
- "Electricity Data Browser". www.eia.gov. Retrieved 2020-11-07.
- "Electricity Data Browser". www.eia.gov. Retrieved 2020-11-10.
- Politics, Talk Business & (2016-03-04). "Entergy closes on $948 million purchase of Union Station power plant in El Dorado". KATV. Retrieved 2020-11-10.
- "Electricity Data Browser". www.eia.gov. Retrieved 2020-12-22.
- "Electricity Data Browser". www.eia.gov. Retrieved 2020-11-07.
- "Electric Power Monthly - U.S. Energy Information Administration (EIA)". www.eia.gov. Retrieved 2020-11-07.
- "Electricity Data Browser". www.eia.gov. Retrieved 2020-12-22.
- "Electricity Data Browser". www.eia.gov. Retrieved 2020-11-07.
This article is issued from Wikipedia. The text is licensed under Creative Commons - Attribution - Sharealike. Additional terms may apply for the media files.